
A mixed earnings report overshadowed the partnership with OpenAI, the announced job cuts, and a promising start to the holiday shopping season. Is it time to go shopping?
Long Trade Idea
Enter your long position between 85.30 (the lower band of its horizontal support zone) and 88.44 (the upper band of its horizontal support zone).
Market Index Analysis
- Target (TGT) is a member of the S&P 100 and the S&P 500
- Both indices are in a bearish chart pattern, with rising downside pressure
- The Bull Bear Power Indicator for the S&P 500 is bearish with a descending trendline and does not confirm the uptrend
Market Sentiment Analysis
Equity markets finished yesterday’s session higher, and equity futures are surging on the back of NVIDIA’s earnings reports and guidance. It suggests the AI trend is strong, and all eyes are on September’s delayed NFP report, expected to show modest job gains. Minutes from the Federal Reserve’s last meeting highlighted different views on future monetary policy. Walmart will report earnings before the bell, offering more data on consumer health following mixed reports from other retailers.
Target Fundamental Analysis
Target is the seventh-largest US retailer focused on upscale, trend-forward merchandise at lower costs. It operates nearly 2,000 stores and has introduced private-label brands to compete on price. It also operates 41 distribution centers and two criminal forensic labs.
So, why am I bullish on TGT following its mixed earnings report?
Revenues of $25.27 billion missed estimates of $25.32 billion, but earnings per share of $1.78 beat expectations of $1.72 and narrowed its full-year outlook. While the OpenAI partnership and potential revenue generation remain unknown, I am bullish on its ongoing cost-cutting initiative, relative strength, the value proposition of its private-label brands, and a promising start to the holiday shopping season, where Target’s trend-forward merchandise could boost sales.
Target Fundamental Analysis Snapshot
Metric | Value | Verdict |
P/E Ratio | 10.43 | Bullish |
P/B Ratio | 2.61 | Bearish |
PEG Ratio | 2.28 | Bullish |
Current Ratio | 0.99 | Bearish |
ROIC-WACC Ratio | Positive | Bullish |
The price-to-earnings (P/E) ratio of 10.43 makes TGT an inexpensive stock. By comparison, the P/E ratio for the S&P 500 is 29.87.
The average analyst price target for TGT is 99.48. It suggests reasonable upside potential with acceptable downside risks.
Target Technical Analysis
Today’s TGT Signal
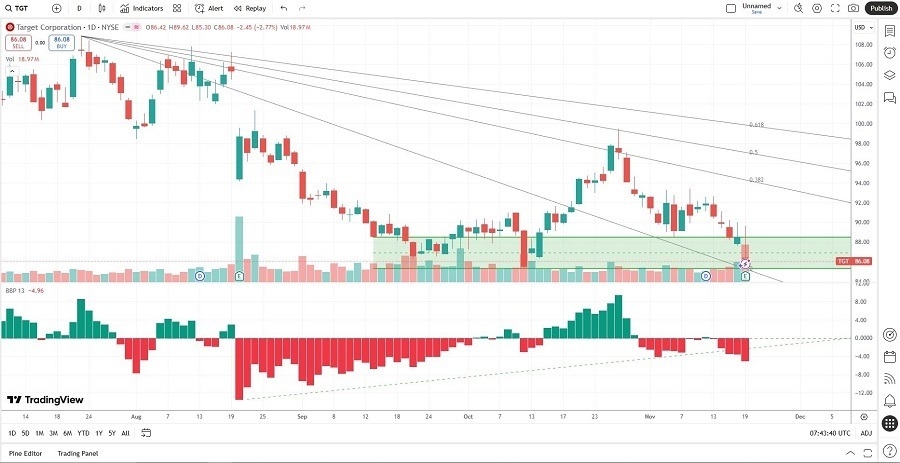
- The TGT D1 chart shows price action inside a horizontal support zone
- It also shows price action trading between its descending 0.0% and 38.2% Fibonacci Retracement Fan
- The Bull Bear Power Indicator is bearish, but within distance to its ascending trendline
- The average bearish trading volumes are higher than the average bullish trading volumes, but show signs of downside exhaustion
- TGT corrected more than the S&P 500, but shows bullish signs that signal a pending reversal
My Call
I am taking a long position in TGT between 85.30 and 88.44. I remain bullish on its value proposition amid the start of the holiday shopping season, where deals remain crucial. Cost-cutting initiatives could improve margins, and the 5%+ dividend yield compensates investors well for medium-term risks.
- TGT Entry Level: Between 85.30 and 88.44
- TGT Take Profit: Between 101.95 and 107.27
- TGT Stop Loss: Between 76.98 and 81.04
- Risk/Reward Ratio: 2.00
Ready to trade our analysis of Target? Here is our list of the best stock brokers worth checking out.