Fundamental Analysis & Market Sentiment
I wrote on 17th March that the best trade opportunities for the week were likely to be:
- Long of the NASDAQ 100 Index following a daily close above 18288. This gave a win of 0.16%.
- Long of the S&P 500 Index following a daily close above 5157. This gave a win of 0.89%.
- Long of Bitcoin, following a daily close above $74,000. This did not set up.
- Long of Gold following a daily close above $2183. This gave a loss of 0.96%.
- Long of Cocoa Futures, but with only half a normal position size. This gave a win of 4.95%.
- Long of CPER (Copper) ETF following a daily close above $25.71. This only set up on a strong down day, so it was not a good signal, but if taken, it gave a loss of 3.03%.
The overall result was a net win of 2.01%, resulting in a gain of 0.34% per asset.
Last week saw very low directional volatility in the Forex market, which has been relatively low since 2024 started.
US stock markets still look very bullish, with the S&P 500 Index standing out as it briefly made a new record high. The slightly higher-than-expected US GDP data released last week caused a minor strengthening of the US Dollar over the past week. We also saw weakness in the Japanese Yen, which resulted in the USD/JPY currency pair briefly trading at a new 34-year high just below ¥152.
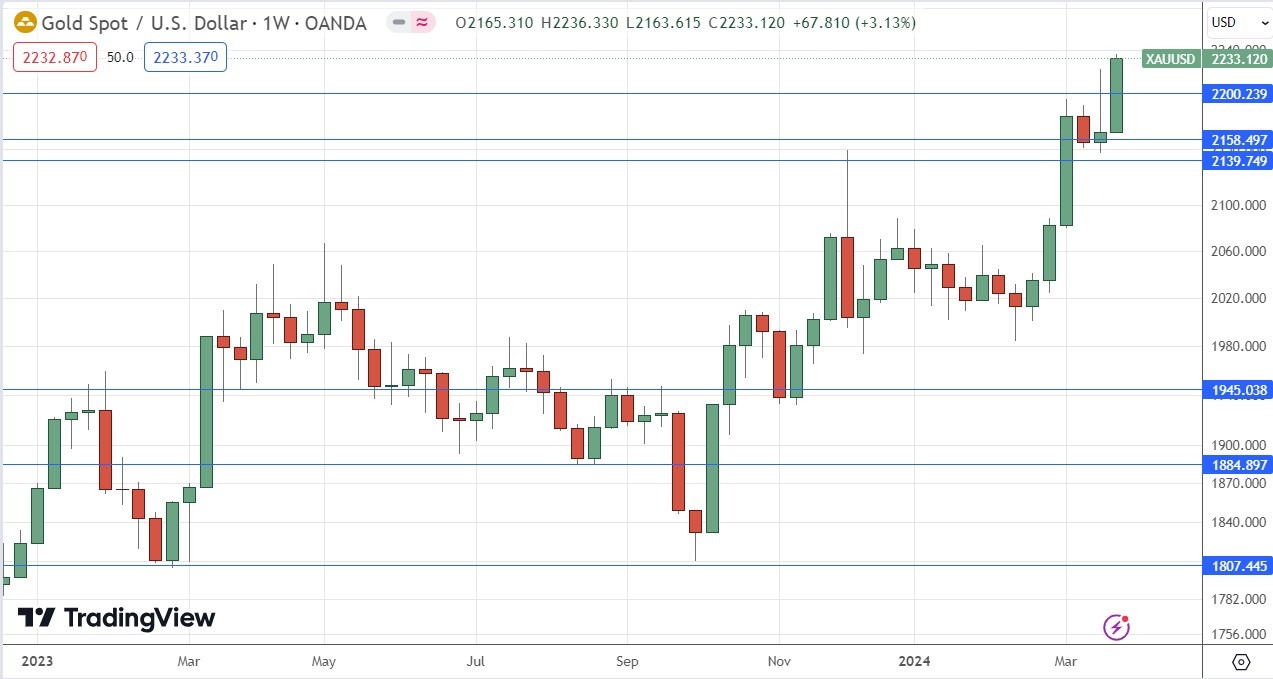
Gold was a standout asset last week as it rose strongly to close right on its fresh all-time high it made on Friday at $2232.
There was interesting action in other commodities markets, with Cocoa futures trading at a new record above $10,000 and, for the first time, becoming more expensive pound for pound than Copper, which has also recently seen a long-term high. WTI Crude Oil is rising to hit new 4-month highs.
There were a few other important economic data releases last week:
- Fed Chair Powell and FOMC Member Waller Spoke on Monetary Policy – no surprises.
- US Core PCE Price Index – a month-on-month increase of 0.3%, exactly as expected.
- US Final GDP – stronger than expected, showing an annualized rate of 3.4%.
- US CB Consumer Confidence – came in a bit lower than expected, suggesting consumers feel less inclined to spend.
- Australian CPI: A little weaker than expected at 3.4%, which pushed the Aussie into losing some value.
- Canadian GDP – stronger than expected, with a monthly increase of 0.6%.
- US Unemployment Claims – as expected.
- US Pending Home Sales – slightly stronger than expected.
- US Revised UoM Consumer Sentiment – a little stronger than expected.
The Week Ahead: 1st – 5th April
The most important items over the coming week will be US Non-Farm Payrolls & Average Earnings, Fed Chair Powell giving a speech, and German Preliminary CPI (inflation) data. Apart from this, there are a few other important items:
- US JOLTS Job Openings
- Swiss CPI (inflation)
- US ISM Services PMI
- US ISM Manufacturing PMI
- US Unemployment Rate
- US Unemployment Claims
- Canadian Unemployment Rate
Monthly Forecast April 2024
I did not make a monthly forecast for March, as no obvious long-term trend in the US Dollar could be relied upon at the start of the month.
For April, the long-term trend in the US Dollar is unclear, so I again refrain from making any monthly Forex forecast.
Weekly Forecast 1st April 2024
Last week, I made no weekly forecast, as there were no strong counter-trend price movements in any currency crosses, which is the basis of my weekly trading strategy.
I again give no forecast this week.
Directional volatility in the Forex market fell last week, with only one of the most important currency pairs fluctuating by more than 1%.
Last week, relative strength was observed in the Canadian Dollar, and relative weakness was observed in the Swiss Franc. The absolute numbers were so small that they were effectively meaningless, although the Swiss Franc has been trending lower over recent weeks so that decline might be significant.
You can trade these forecasts in a real or demo Forex brokerage account.
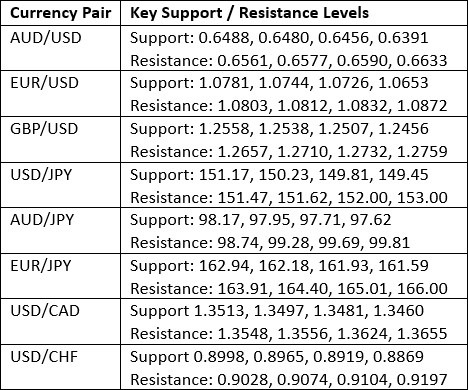
Key Support/Resistance Levels for Popular Pairs
Technical Analysis
US Dollar Index
The US Dollar Index printed a small doji candlestick last week, with the key resistance level at 104.47 holding the upper boundary of the week's price action. The weekly close presented a mixed long-term trend, as it was higher than three months ago but lower than six months ago.
Zooming out to look at the long-term price action shows that the US Dollar Index may have just broken decisively above the narrowing triangle pattern, which would be a bullish sign.
The problem is the resistance at 104.47 looks strong and may continue to hold down the price.
It makes sense to ignore the US Dollar over the coming week. It has no trend, although there is some short-term bullish momentum. Until we see more direction, it will likely be wise to trade non-USD assets and avoid Forex as an asset class.
If the coming week ends with a bullish close above 104.47, that could signify the start of a major bullish price movement, but this is unlikely to happen. The rise in the Dollar is due more to flow into US investments than a rise in the relative value of the greenback itself.
S&P 500 Index
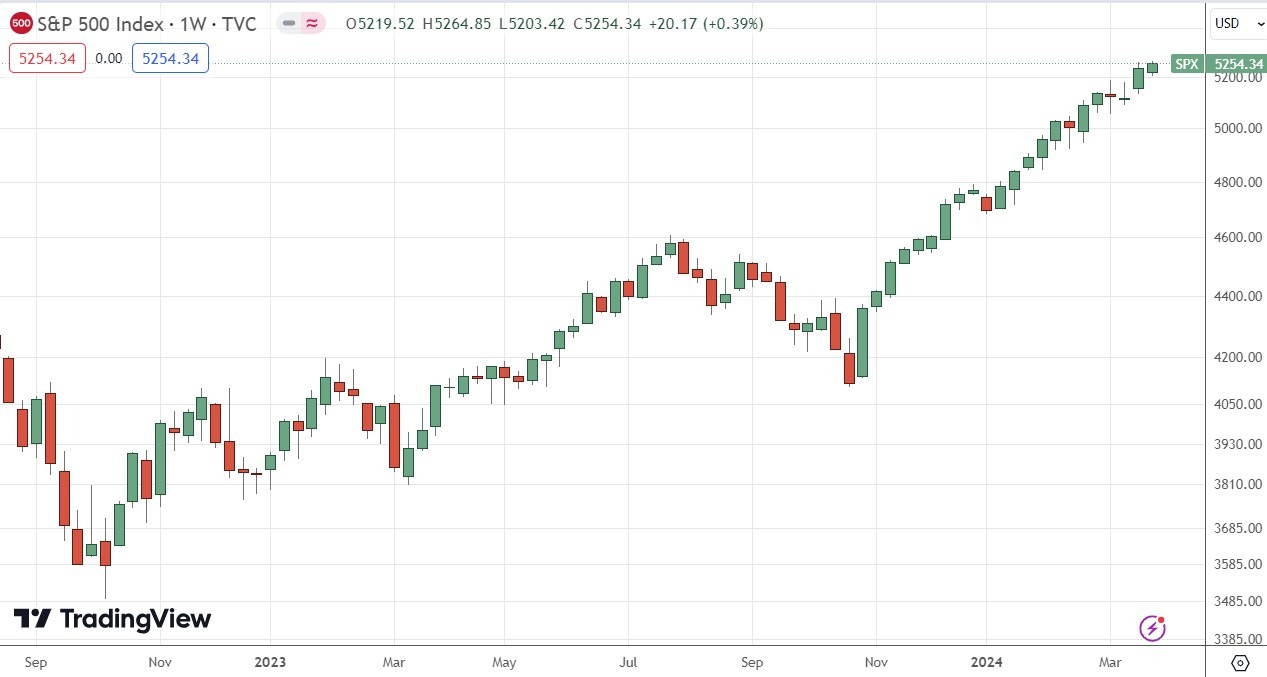
The S&P 500 Index printed another bullish candlestick last week and briefly traded at a new record high the previous week. The weekly close was the highest ever, and the close was also near the top of the week’s range. These are bullish signs.
There is more confidence that the Fed will cut later this year, which helps bulls.
Notably, this Index performed better last week than the NASDAQ 100 Index, which typically outperforms it.
The long-term outlook is bullish because its first break to a fresh all-time high, as happened just a few weeks ago, has historically generated an advance of a median of 13% over the following year.
Bitcoin
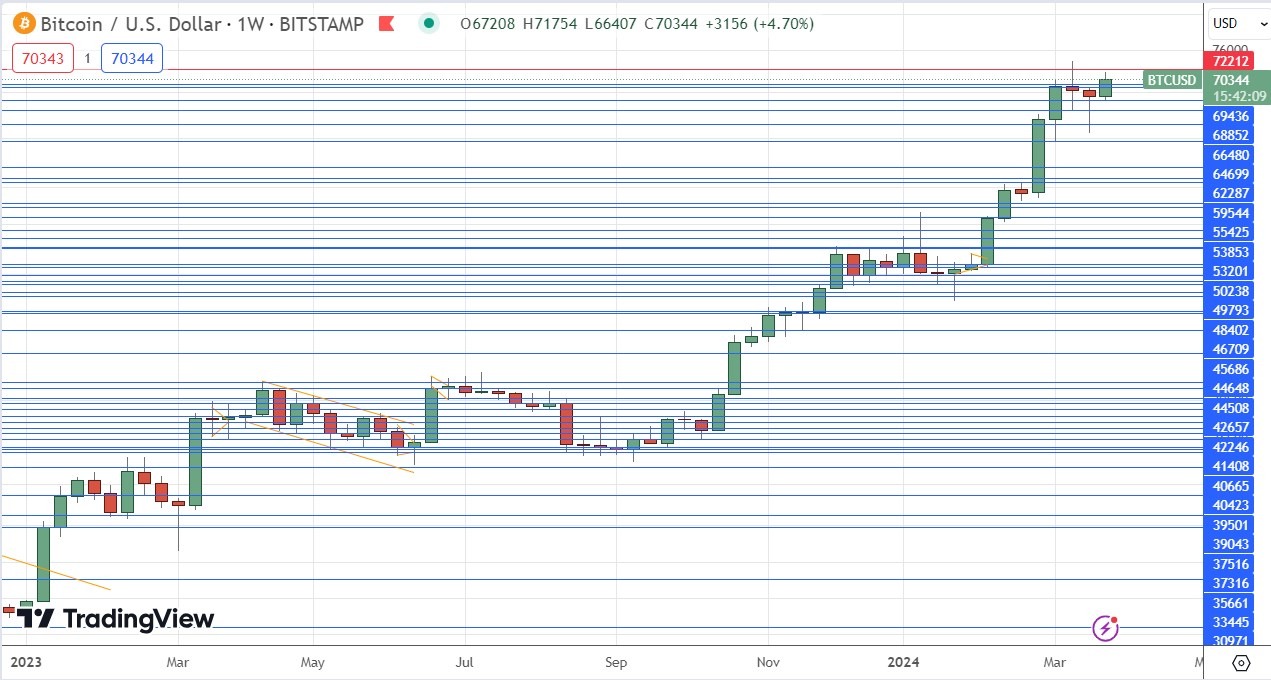
After two indecisive weeks, Bitcoin is looking more bullish. It ended the week with its highest-ever weekly close. Despite that, the bullishness seems a little muted, as the price is struggling to establish itself above the key resistance level of $72,212.
Bitcoin is a buy once we get a daily close at new highs above $74,000. We see several speculative assets, such as commodities and stocks, rising and testing record highs, so there is no reason for Bitcoin to be any exception, especially as Bitcoin ETFs are now available for retail traders who don't have the size to trade Bitcoin futures safely.
Using a trailing stop in this kind of trade is important due to the high volatility and unpredictability inherent to even major cryptocurrencies such as Bitcoin.
Gold
Gold rose very strongly last week, printing a large bullish candlestick which closed extremely close to the top of its weekly price range. The close was at an all-time high price for every major currency, even the strong USD.
Gold is remarkably strong now, having risen convincingly during the strong risk-on rally of recent weeks if it can be called that for simplicity's sake. It is important to remember that Gold has historically been positively correlated with the stock market and other risky assets, and it is far from being a hedge against them as is commonly supposed.
I see Gold as a buy right now.
USD/JPY
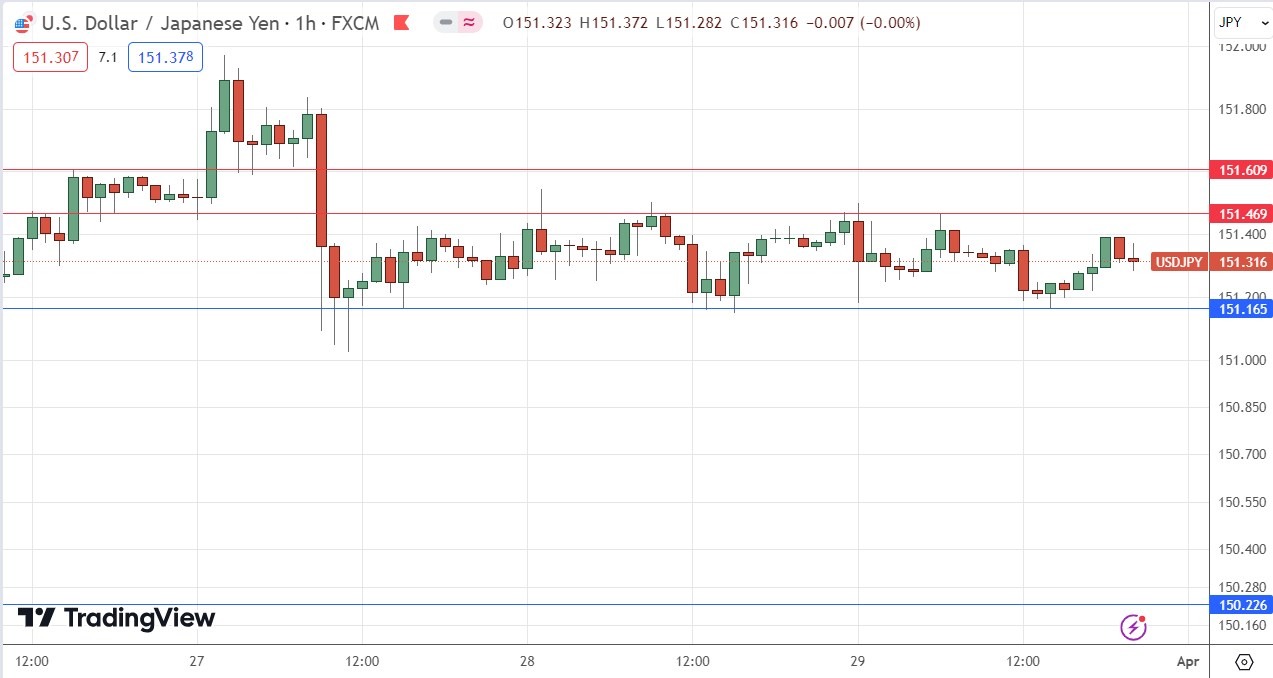
The USD/JPY currency pair briefly made a new 34-year high price of just under ¥152 but could only break the record by a few pips before falling back. The Bank of Japan and the Japanese Finance Ministry are determined to prevent the Yen from weakening much further, which it seems liable to do despite the recent rake hike and abandonment of an ultra-loose monetary policy by the Bank of Japan over recent weeks.
Key support levels continue to hold, and trend traders and other investors and traders are still entering long trades or at least holding onto them. However, the above resistance at ¥152 seems to be a formidable barrier, so it is unclear which will give way first - ¥152 or the support level at ¥151.17.
Cocoa Futures
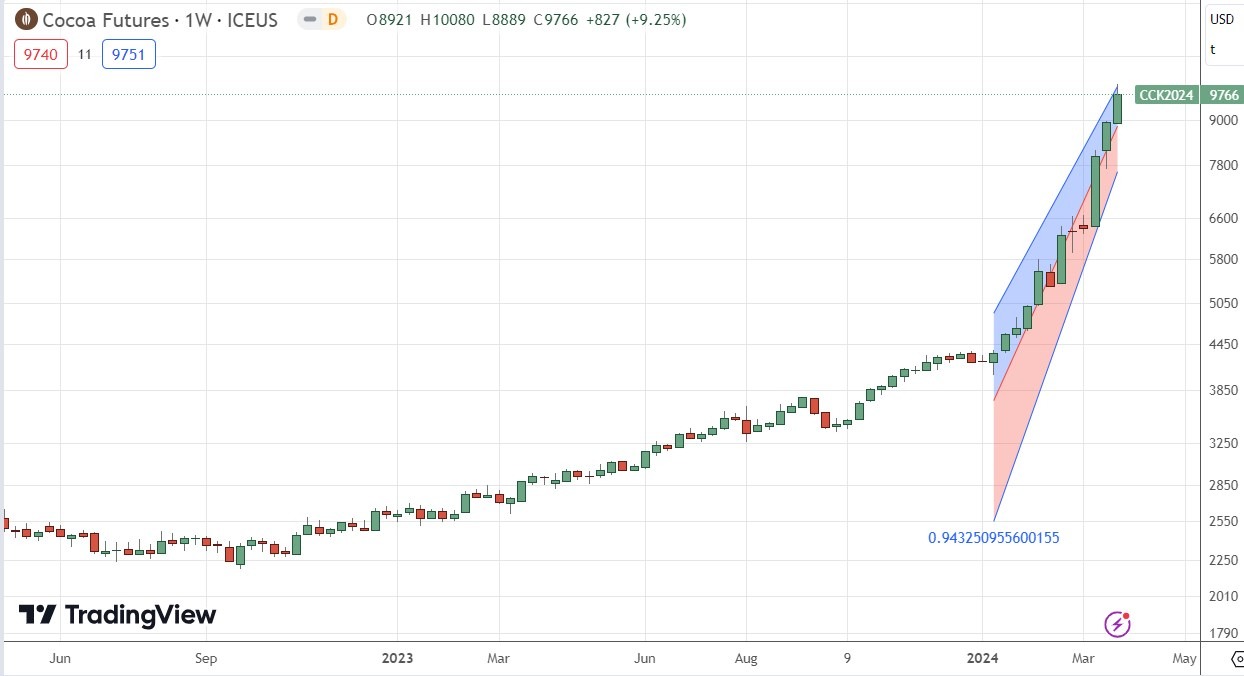
Cocoa Futures made yet another strong bullish move last week and rose by almost 10% to a new multiyear high. The price closed quite near the top of its range, which is bullish.
You can apply a linear regression analysis to the start of the increased bullish momentum 13 weeks ago. Since then, the price of Cocoa futures has more than doubled! Cocoa is now more expensive pound for pound than Copper.
Cocoa is trading near its all-time high, so it can be bought right now as a breakout, although there is always a risk of a sudden bearish reversal. Using a trailing stop in this kind of trade is extremely important.
Bottom Line
I see the best trading opportunities this week as follows:
- Long of the S&P 500 Index.
- Long of Bitcoin, following a daily close above $74,000.
- Long of Gold.
- Long of the USD/JPY currency pair following a daily close above ¥152.
- Long of Cocoa Futures, but with only half a normal position size.
Ready to trade our Forex weekly analysis? We’ve shortlisted the best Forex trading brokers in the industry for you.


