The difference between success and failure in Forex / CFD trading is highly likely to depend mostly upon which assets you choose to trade each week and in which direction, and not on the exact methods you might use to determine trade entries and exits.
So, when starting the week, it is a good idea to look at the big picture of what is developing in the market as a whole, and how such developments and affected by macro fundamentals, technical factors, and market sentiment.
Read on to get my weekly analysis below.
Fundamental Analysis & Market Sentiment
I wrote in my previous piece on 1st October that the best trade opportunities for the week were likely to be:
- Long of the USD/JPY currency pair. This pair ended the week 0.06% lower.
- Long of WTI Crude Oil futures following a new daily close above $93. This did not set up.
- Short of the EUR/USD currency pair following a new daily close below $1.0500. The price closed at $1.0476 on Monday, but unfortunately rose since then by 1.02% to the end of the week.
The week’s trades produced an overall loss of 1.08%, giving an average loss of 0.35% per asset.
Recent weeks have seen a deterioration in risk sentiment, which has sent stock markets lower and the US Dollar higher, but a more complex picture has emerged in recent days despite high yields and volatile bond markets. The US Dollar gave up its gains made earlier in the week, while stocks rose. The main story of the week is the resilience of stock markets, and we saw a very key support level in the NASDAQ 100 Index continue to hold despite coming under pressure.
Last week was quite light in terms of major data releases, with the major event being the US non-farm payrolls and average earnings data, which showed almost double the number of new jobs had been created than the expected amount, that average earnings rose by only 0.2% compared to the expected 0.3%, and that the unemployment rate rose slightly to 3.8%. The data suggests a slightly cooler than expected US economy which might support the current minor rally in stocks.
US JOLTS Job Openings data came in higher than expected, which correctly pointed to a strong NFP number. The other major Forex market events were the meetings of the Reserve Bank of Australia and the Reserve Bank of New Zealand, both of which maintained interest rates at their pre-existing levels, as was widely expected.
Last week’s other key data releases were:
- Swiss CPI (inflation) – this came in lower than expected, showing a month-on-month decline of 0.1% when no monthly change was expected.
- US ISM Services PMI – this came in as expected.
- US ISM Manufacturing PMI – this came is slightly better than expected.
- Canadian Unemployment Rate and Employment Change – just as it was in the USA, a considerably higher number of new jobs were created last month in Canada, resulting in the Canadian unemployment rate falling unexpectedly.
There were no major surprises.
The Week Ahead: 9th October – 13th October
The coming week in the markets is likely to see a higher level of volatility than last week, as there will be a release of highly important US CPI (inflation) data. This week’s key data releases are, in order of importance:
- US CPI (inflation)
- US FOMC Meeting Minutes
- US PPI
- UK GDP
- US Preliminary UoM Consumer Sentiment
- US Unemployment Claims
- China CPI (inflation)
It is a public holiday this Monday in the USA, Japan, and Canada.
Technical Analysis
US Dollar Index
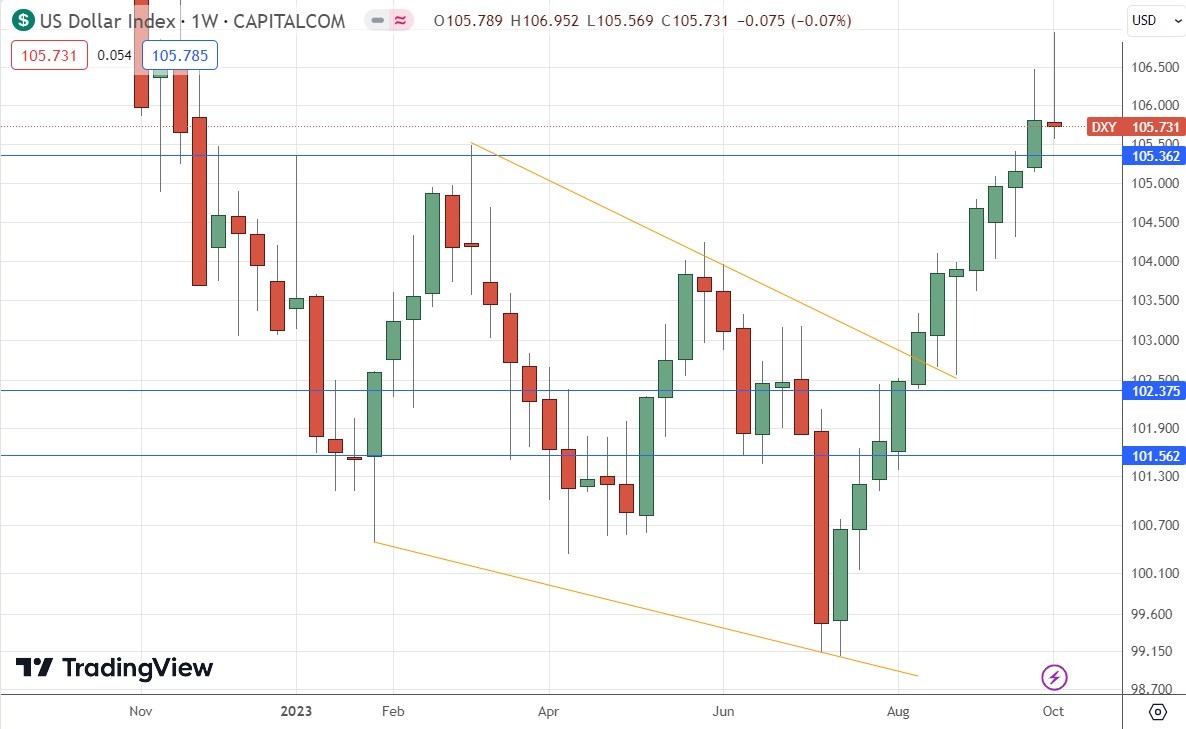
After eleven consecutive weeks of gains, the US Dollar Index finally closed lower at the end of last week, but only by a very small amount. The weekly candlestick is a bearish pin bar. These factors may indicate that while the long-term trend remains bullish, we are about to see a deeper retracement. This could be supported by markets beginning to re-establish some risk appetite despite the environment of relatively high bond yields.
One factor worth monitoring over the coming week will probably be the nearby support level at 105.36. If this level holds, it will be a bullish sign. Over the short-term, much will likely depend on whether the US CPI (inflation) data release due this coming Wednesday will come in higher or lower than expected.

USD/JPY
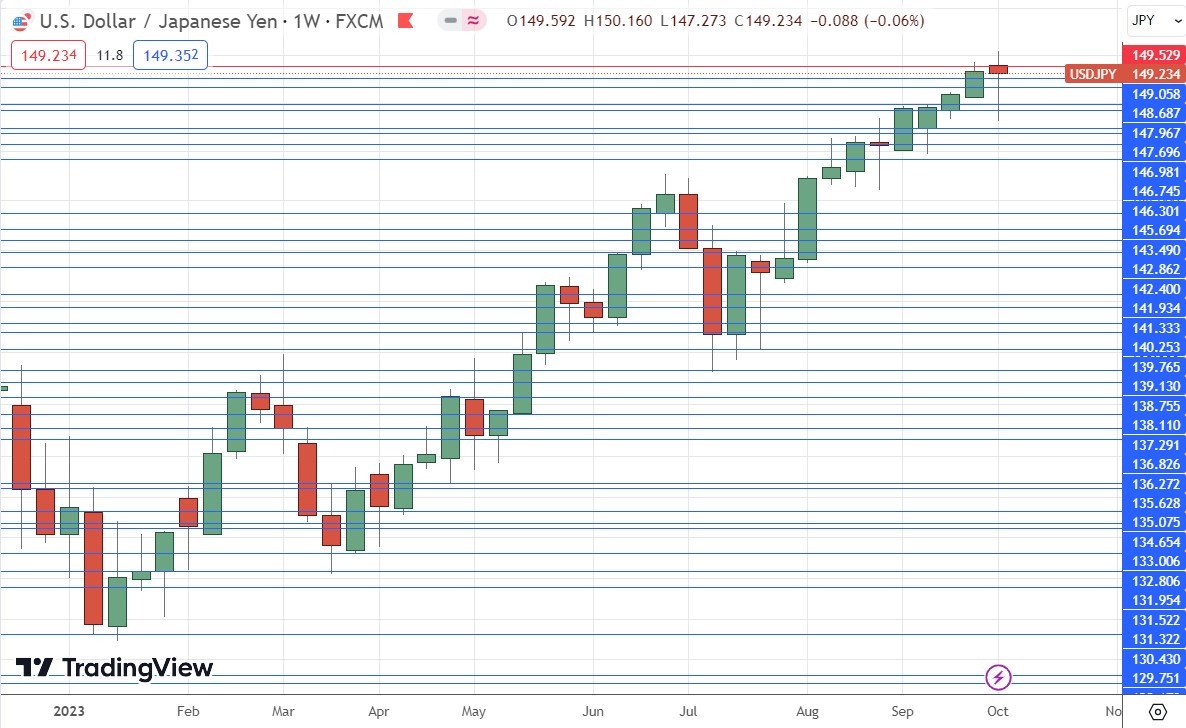
The USD/JPY currency pair behaved a bit unusually compared to other currency pairs involving the US Dollar, by printing a pin bar supporting rather than undermining the US Dollar.
This happened during last week when the price made a new 11-month high above the big round number at ¥150 before falling back.
I still see this currency pair as a long-term buy due to the very loose monetary policy of the Bank of Japan, as well the long-term downwards trend in the Yen.
However, it may be wise to wait for a daily close very near the high of the day’s range which is also above that round number at ¥150.

EUR/USD
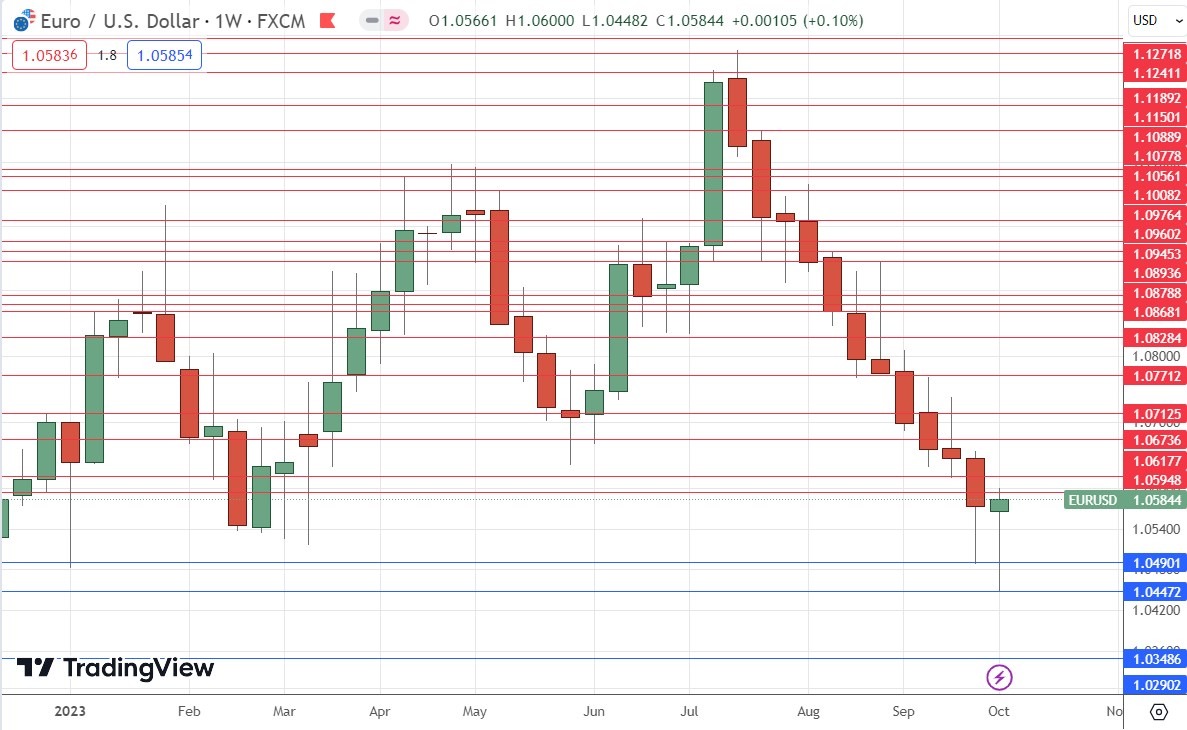
The EUR/USD currency pair briefly touched a new multi-month low below the big round number at $1.0500 early last week before rebounding quite firmly. The weekly candlestick shown in the price chart below is a bullish pin bar, suggesting that we may now see a deeper bullish retracement against the long-term bearish trend.
It may be that it was the price arriving at the big round number of $1.0500 that brought in buyers, but trading against the long-term trend can be tricky and dangerous.
I remain prepared to enter a new short trade but only following a daily close below $1.0500.

Gold
After falling very strongly over the previous week, the price of Gold fell again last week, and although it closed lower it did recover towards the end of the week after reaching a new 6-month low price.
It may be that the support level shown in the price chart below at $1807 had an effect of bringing in buyers as the price got close to it.
We have seen many commodities fall over the past week, so the downwards move makes sense here, and is supported by a long-term bearish trend. However, shorting Gold can be quite tricky, as its bearish trends have tended to be rather unreliable during recent years.
Another reason why the decline in Gold is notable is that stock markets, with which Gold is usually highly positively correlated, ended last week mostly higher.
If the price of Gold makes a daily close below the support level at $1807 and the round number at $1800, I will be prepared to enter a new short trade.

NASDAQ 100 Index
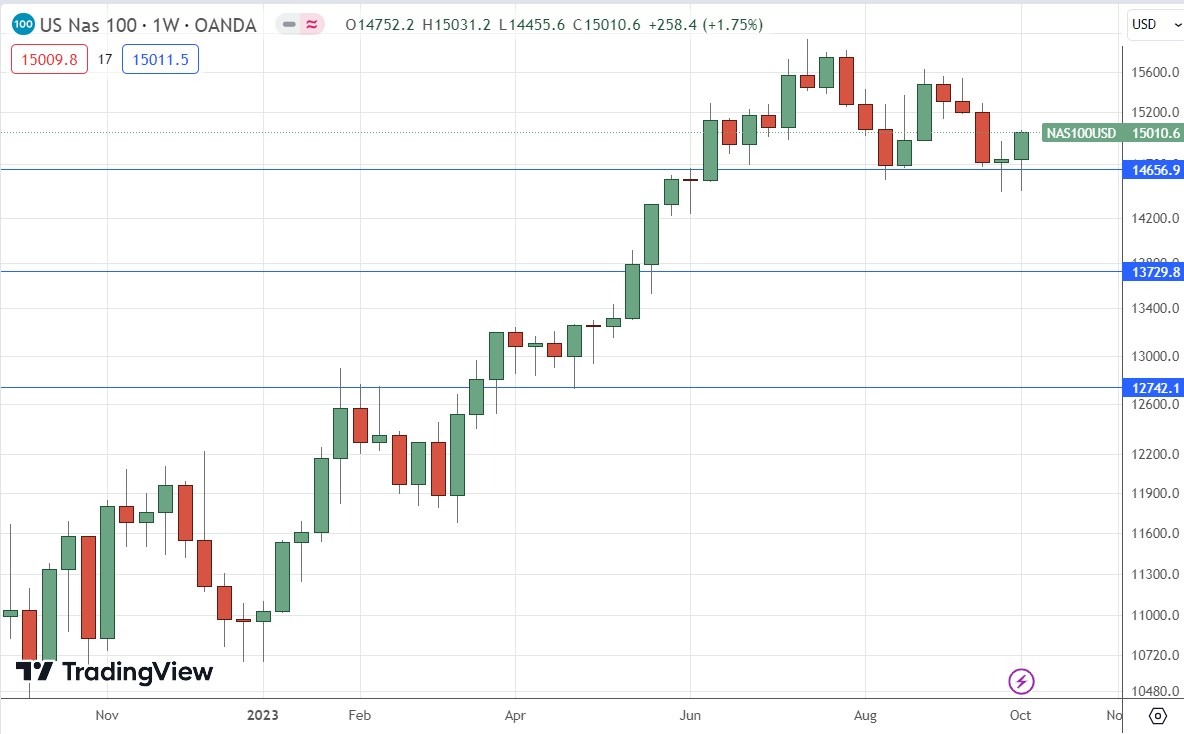
The NASDAQ 100 Index again rejected the key support level which I identified at 14,657. The price seems to be finding some support in a very pivotal area.
The weekly candlestick closed near the high of the range and formed a bullish engulfing (or outside) candlestick. These are bullish signs.
Markets seem to have rediscovered some risk appetite despite relatively high and in some cases rising rates and yields.
The NASDAQ 100 Index may make sense now as a long-term buy, but I prefer to wait for more bullish price action before getting involved here.

Bottom Line
I see the best trading opportunities this week as:
- Long of the USD/JPY currency pair following a new daily close above ¥150.
- Short of the EUR/USD currency pair following a new daily close below $1.0500.
- Short of Gold following a new daily close below $1800.
Ready to trade our Forex weekly forecast? Here’s a list of some of the best Forex trading platforms to check out.
