
The difference between success and failure in Forex / CFD trading is highly likely to depend mostly upon which assets you choose to trade each week and in which direction, and not on the exact methods you might use to determine trade entries and exits.
So, when starting the week, it is a good idea to look at the big picture of what is developing in the market as a whole, and how such developments and affected by macro fundamentals, technical factors, and market sentiment.
Read on to get my weekly analysis below.
Fundamental Analysis & Market Sentiment
I wrote in my previous piece on 24th September that the best trade opportunities for the week were likely to be:
- Short of the GBP/USD currency pair targeting a take profit of $1.2168. This was a profitable trade, as the price reached that target last week.
- Long of USD/JPY. The currency pair saw an increase of 0.65% over the week.
- Long of WTI Crude Oil futures following a new daily close above $92.10. This produced a loss of 3.08%.
- Long of No. 11 Sugar futures following a new daily close above $27.50. This did not set up.
The week’s trades produced an overall loss, but I cannot quantify it as the risk on the GBP/USD trade is particular to each trader’s style.
Over the past week, risk sentiment has remained sour, and the main reason for this is the Fed’s policy meeting two weeks ago which produced a “hawkish hold”. While the Fed left rates unchanged as expected, the Fed now expects it will raise rates again by 0.25% later in 2023, meaning the terminal rate of the current tightening cycle is not yet reached.
Last week was quite light in terms of major data releases, with the major events being the US Core PCE Price Index which is looked at for clues about inflation, and Final GDP, which is an assessment of economic growth. The PCE came in a fraction lower than had been expected, which may be a positive sign concerning inflation. Final GDP also came in a fraction lower than expected.
Last week’s other key data releases were:
- US CB Consumer Confidence – a little worse than expected.
- Australian CPI (inflation) – an annualized rate of 5.2%, exactly as expected.
- US Unemployment Claims – a fraction better than expected.
- Canadian GDP – slightly worse than expected.
- US Revised UoM Consumer Sentiment – slightly better than expected.
- German IFO Business Climate Data – a fraction better than expected.
- China Manufacturing PMI – as expected.
There were no real surprises.
The Week Ahead: 2nd October – 6th October
The coming week in the markets is likely to see a low level of volatility than last week, as there are few high-impact data releases scheduled, although we might see considerable action in the AUD and NZD as there are central bank releases due concerning each of them. This week’s key data releases are, in order of importance:
- US Non-Farm Employment Change, Average Hourly Earnings, and Unemployment Rate
- US JOLTS Job Openings
- RBA Rate Statement and Cash Rate
- RBNZ Rate Statement & Official Cash Rate
- Swiss CPI (inflation)
- US ISM Services PMI
- US ISM Manufacturing PMI
- US Unemployment Claims
- Canadian Unemployment Rate and Employment Change
It is a public holiday Monday in Australia, Canada, and China. Tuesday is a public holiday in China and Germany. The rest of the week is a public holiday in China.
Technical Analysis
US Dollar Index
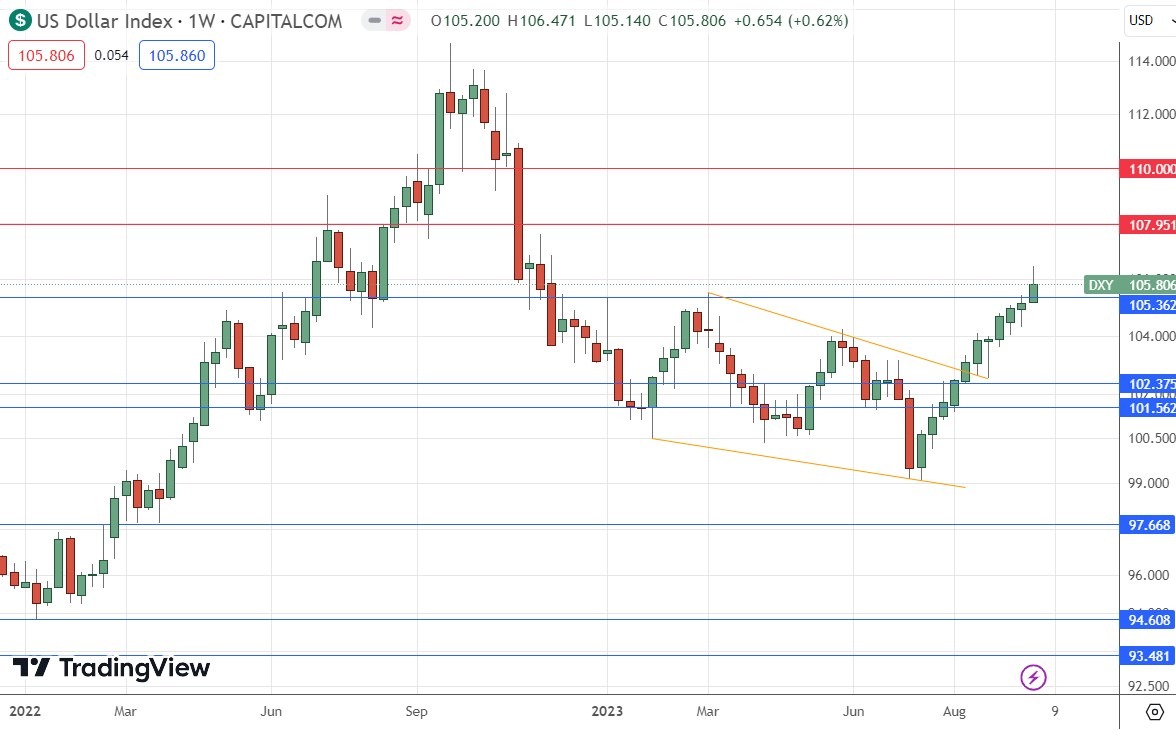
The week price chart below shows the U.S. Dollar Index advanced again last week for the eleventh consecutive week, to close at a new 10-month high price, continuing its remarkable long-term bullish trend. It broke above the former key resistance level at 105.36.
These are bullish signs, but it should be noted that weekly candlestick printed a considerably large upper wick, suggesting that there may be selling pressure above.
The Dollar is in a long-term bullish trend evidenced by the price trading above its levels from 3 months and 6 months ago.
I see the US Dollar as having bullish momentum, which means it is probably a good idea to only look for long trades in the US Dollar this week. However, bulls should beware of the momentum slowing down.
GBP/USD
The GBP/USD currency pair printed a down candlestick, but the second half of the week saw the price make quite a firm comeback. In the end, the weekly candlestick can be interpreted as a pin bar, which might be bullish.
This pair is in focus right now as the US Dollar is strong and trending up, while the British Pound has seen renewed selling since the Bank of England narrowly voted to pass on an expected rate hike two weeks ago, while British inflation data came in lower than expected.
The price made a new 6-month low and there is certainly a strong long-term bearish trend, but buyers seem to be stepping in as the price gets near $1.2000.
I do not want to enter a new trade here at this time either long or short. If the price can get established later below the $1.2000 area, that will be a bearish sign.

USD/JPY
The USD/JPY currency pair printed a bullish candlestick which had a full real body. The price made the highest weekly close seen in almost an entire year. The price also closed quite near its high, which is another bullish sign. However, bulls should be a little worried that the price did not manage to clear the resistance level at ¥149.51. Having said that, the volatility was quite normal, so arguably not much should be read into this.
I still see this currency pair as a long-term buy due to the very loose monetary policy of the Bank of Japan, as well the long-term downwards trend in the Yen.
It is also true that the big round number at ¥150 produced a strong bearish reversal the last time it was reached – it could do so again.
I still see this currency pair as a buy.

EUR/USD
The EUR/USD currency pair printed a down candlestick, but the second half of the week saw the price make quite a firm comeback. The weekly candlestick shown in the price chart below has a significant lower wick.
The price made a new 9-month low and there is certainly a strong long-term bearish trend, but looking at the chart, you can question how healthy this trend really is, as the very long-term price action suggests ranging behavior.
It may be that it was the price arriving at the big round number of $1.0500 that brought in buyers, so bears should probably not enter any new short trades above that price area.

WTI Crude Oil
The current WTI Crude Oil future rose very slightly over the past week, after breaking out to a new 10-month high price. However, the weekly candlestick is not far from looking like a bearish pin bar, which should give bulls some pause for thought.
The deterioration in risk sentiment, or at least its secondary effect of suggesting we will see a stronger slowdown in global economic growth, is bad news for crude oil bulls.
However, there is a valid long-term trend and OPEC has recently taken restrictive measures. Trend trading commodities long when they make bullish breakouts to new long-term high prices has historically been a very profitable trading strategy.
I still see WTI Crude Oil as a buy, but only following a daily close above $93. That would put the price into blue sky, but the very large round number at $100 might act as natural resistance.

NASDAQ 100 Index
The NASDAQ 100 Index barely changed over the past week, again closing just above the key support level which I identified at 14,657. It probably continues down as a zone of support, to approximately 14,500.
The price seems to be finding some support in a very pivotal area.
I do not want to be long of stocks except in terms of a very long-term investment. Short selling can be very dangerous and is likely best left to experts, but we may see a stronger fall here if we get a daily close below 14,500.
However, it may be a bullish sign that the price just will not seem to get established below 14,657.

Bottom Line
I see the best trading opportunities this week as:
- Long of the USD/JPY currency pair.
- Long of WTI Crude Oil futures following a new daily close above $93.
- Short of the EUR/USD currency pair following a new daily close below $1.0500.
Ready to trade our weekly Forex forecast? Here are the best Forex brokers to choose from.