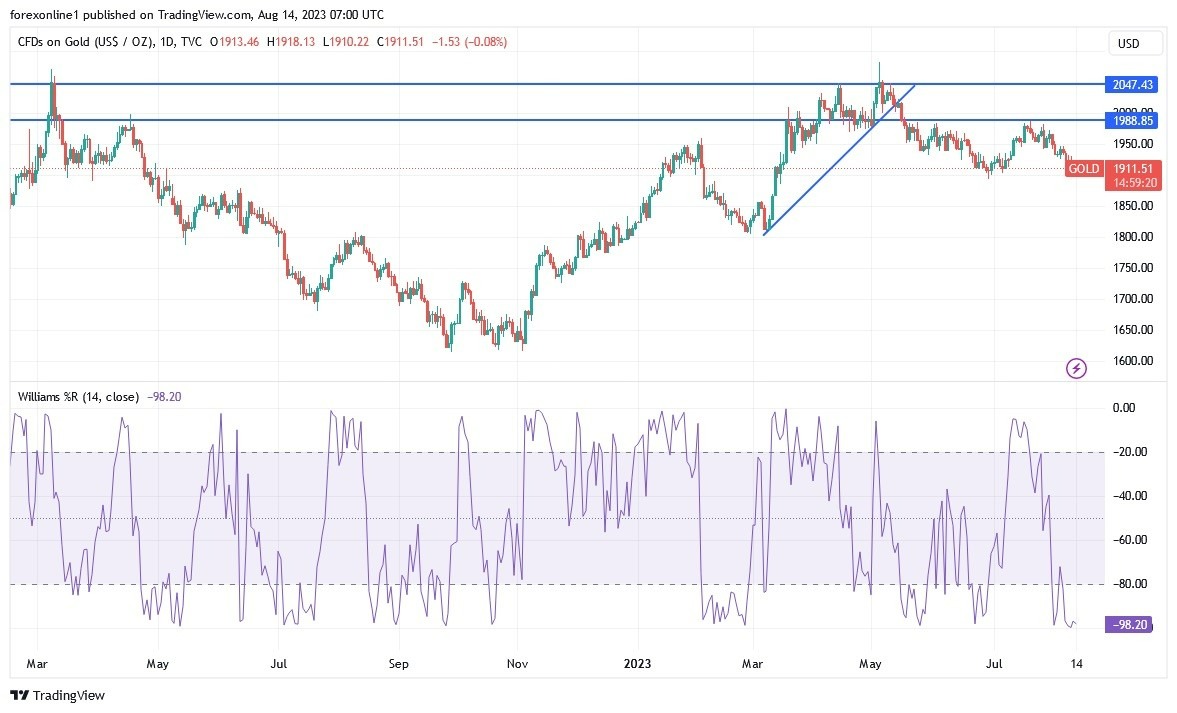
- The continued strength of the US dollar helped in the collapse of the gold price to the support level of 1911 dollars an ounce, its lowest in a month, and it will start trading this week, stable around its recent losses.
- The main economic report for financial markets last week was the US inflation data. It showed that the process of reducing inflation continues in the United States. Economists expected annual inflation to rise to 3.3%, but actual inflation came in at 3.2%.
- Also, the monthly core CPI came in at 0.2%. The trend shows that inflation (i.e. rising inflation but at a slower rate) is the name of the game in the US - good news for the Federal Reserve which is trying to push inflation up to its 2% target.
Besides the actual numbers, the US inflation report for July contains some interesting developments. First, it shows slower demand on services. For example, restaurant price momentum is slowing rapidly. Domestic airfare prices are also slowing down. And secondly, while the process of lowering inflation is still underway, the risks from higher energy prices are worth noting in the coming months.
Ahead of the US July CPI report, the odds of a September rate hike were 15%. After the report, they dropped to 10%. And the Fed has never ignored market rates, so the chances of a rate hike in September are close to zero. Thus, the report must have triggered a bearish reaction in the US dollar and a bullish reaction in the stock market. But she didn't. In general, summer trading brings slow-moving markets, which may be the reason for the weak reaction to the inflation report. Or maybe, because the economic data came in roughly as expected, it means it's already been priced in. All in all, the US CPI report brought good news for the Federal Reserve. It could just be that the Fed is closer to the final interest rate, in which case the US dollar is having a hard time rallying.
On another important economic level. US Initial Jobless Claims for the week ending August 4th missed the expected claims count of 230K with an overall rise of 248K. Continuing claims for the previous week exceeded the estimated toll of 1.71 million by 1.684 million. Elsewhere, the July cash budget statement missed the expected change of -109.3 billion with -221 billion.
Gold Technical Outlook
Gold price remains a few levels below the 100-hour moving average despite the rebound. However, it appears to be approaching the overbought levels of the 14-hour RSI. In the near term, and according to the performance on the hourly chart, it appears that the gold price is trading within a bullish channel formation. The MACD indicator is indicating a broad crossover, which supports the current bullish trend. Therefore, the bulls will look to extend the current run of gains towards $1.922 or higher to the $1.926 resistance. On the other hand, the bears will target potential pullback profits at around $1,914 or lower at $1,910 an ounce.
In the long term and according to the performance on the daily chart, it appears that the gold price is trading within a bearish channel formation. It also appears that MACD has recently completed a bearish cross which supports the bearish case. Therefore, the bears will look to extend the current declines towards $1892 or below to the $1866 support. On the other hand, the bulls will target long-term profits around $1938 or higher at the $1.964 resistance.
 Ready to trade today’s Gold prediction? Here’s a list of some of the best XAU/USD brokers to check out.
