The difference between success and failure in Forex / CFD trading is highly likely to depend mostly upon which assets you choose to trade each week and in which direction, and not on the exact methods you might use to determine trade entries and exits.
So, when starting the week, it is a good idea to look at the big picture of what is developing in the market as a whole, and how such developments and affected by macro fundamentals, technical factors, and market sentiment. There are some long-term trends in the market right now, which might be exploited profitably.
Read on to get my weekly analysis below.
Fundamental Analysis & Market Sentiment
I wrote in my previous piece on 2nd July that the best trade opportunities for the week were likely to be:
- Long of the USD/JPY currency pair following a daily close above ¥145. This did not set up.
- Long of Bitcoin after a daily close above $31k. This set up on Monday, but the price has fallen by 2.85% since then.
- Long of the NASDAQ 100 Index. The price fell by 0.74% over the past week.
My forecast produced an overall loss of 3.59%, averaging a loss of 1.20% per highlighted asset.
When markets open for the week later, they are likely to be focused on last Friday’s US jobs and average earnings data. Last Friday saw the lowest number of net non-farm payrolls jobs created in any month since 2020 (209,000), although average earnings were shown to have increased by more than expected, by 0.4% and not the 0.3% which was expected. These data were not well received by the market, which sees it as a sign that US inflation is still running a bit hot despite its recent decline. The FOMC meeting minutes released earlier in the week contained no real new information that was able to impact the market.
This focus on last week will not likely last long as the coming week will bring the highly important US CPI data, and the importance of this cannot be stressed highly enough.
Markets ended the week with major equity indices mostly lower, despite many of them having recently reached long-term highs, especially in the USA, and the US Dollar lower too.
Last week’s other key data releases were:
- US JOLTS Job Openings – this was slightly lower than expected, matching the lower NFP data, suggesting the labor market is cooling.
- US ISM Services & Manufacturing PMI – services came in higher than expected, manufacturing came in lower.
- US Unemployment Rate - as expected, this remained unchanged at 3.6%.
- RBA Cash Rate & Rate Statement – as expected, the RBA passed on a rate hike, which knocked the Aussie a little.
- Swiss CPI (inflation) – increased by only 0.1% month on month when an increase of 0.2% was expected.
- OPEC Meetings – further production cuts were agreed.
- Canadian Unemployment – this was expected to rise slightly but rose by a little more than expected, from 5.2% to 5.4%.
The Week Ahead: 10th July – 14th July
The coming week in the markets is likely to see a slightly higher level of volatility than last week, as there will be a release of highly important US inflation data plus two major central bank policy meetings. This week’s key data releases are, in order of importance:
- US CPI (inflation)
- US PPI
- Bank of Canada Overnight Rate and Rate Statement
- RBNZ Official Cash Rate and Rate Statement
- UK GDP
- US Preliminary UoM Consumer Sentiment
- UK Unemployment Claims (Claimant Count Change)
Friday will be a public holiday in France and New Zealand.
Technical Analysis
US Dollar Index
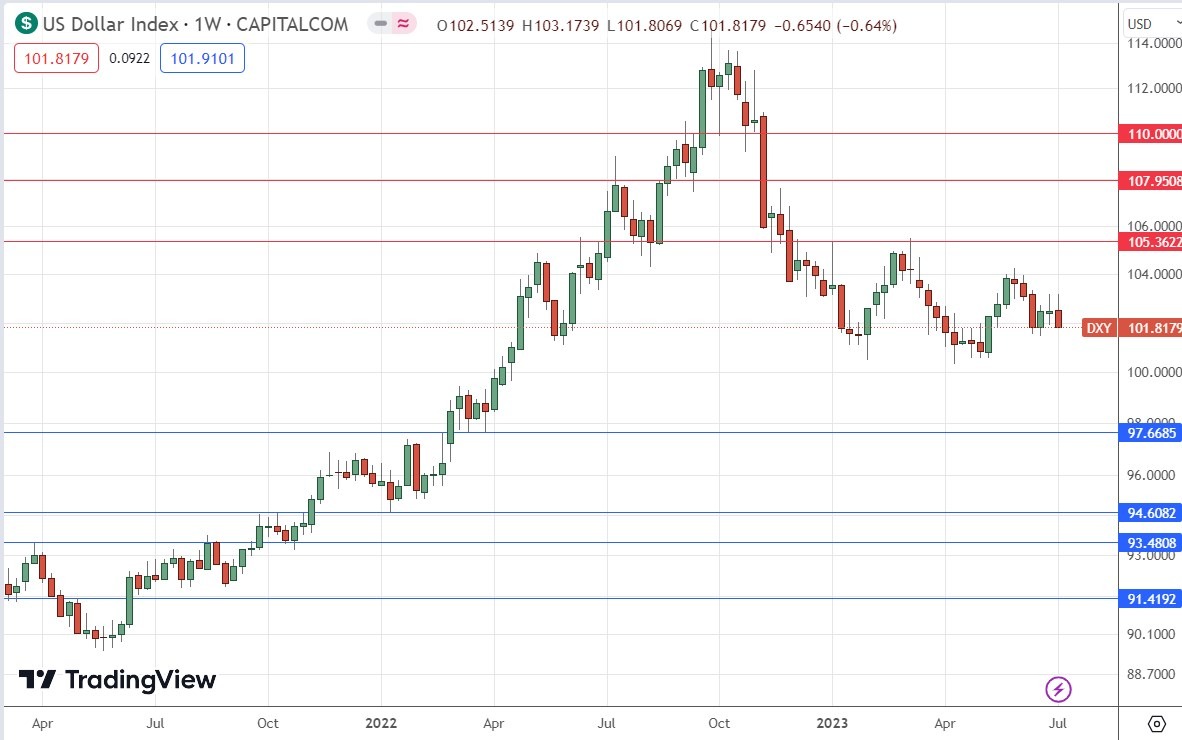
The weekly price chart below shows the U.S. Dollar Index printed a bearish engulfing candlestick last week. The price closed right on the low of its range, which suggests strong bearish momentum. However, taking a longer-term view, the Dollar is clearly going nowhere and stands priced in the middle of quite a long-term consolidation. The price is higher than it was 3 months ago but lower than it was 6 months ago, indicating the absence of any long-term trend.
Despite the consolidation pattern, I do see a bearish sign in the US Dollar, in that it is falling even as the 2-year US treasury yield is rising to new and significant highs above 5%.
I think it will make most sense to trade the US Dollar short over the coming week despite the indecisive consolidation pattern.
NASDAQ 100 Index
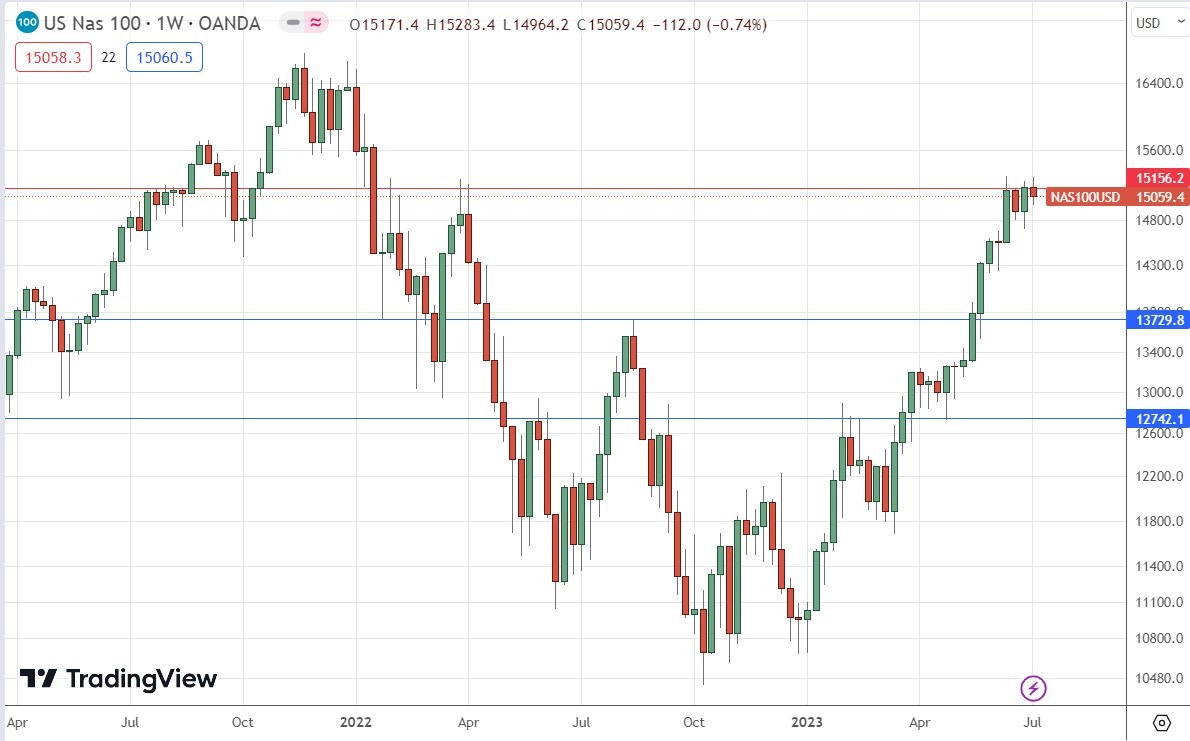
Last week saw a price fall after a strong period of gains in the NASDAQ 100 Index. I had seen this equity index as bullish after it made a daily close above the resistance level which I had identified at 15156.2, but it is looking as if I should have drawn that level a little higher as we do seem to be getting some resistance here.
Although we have seen a bearish retracement, it is not very deep, so bulls should not be overly alarmed. We still see strong long-term bullish momentum here. However, we may have just seen a failed breakout, which could be a bearish sign.
I will respect the strong long-term bullish momentum and look for a buy if we get a daily close above the recent long-term high at 15297.2.
GBP/USD
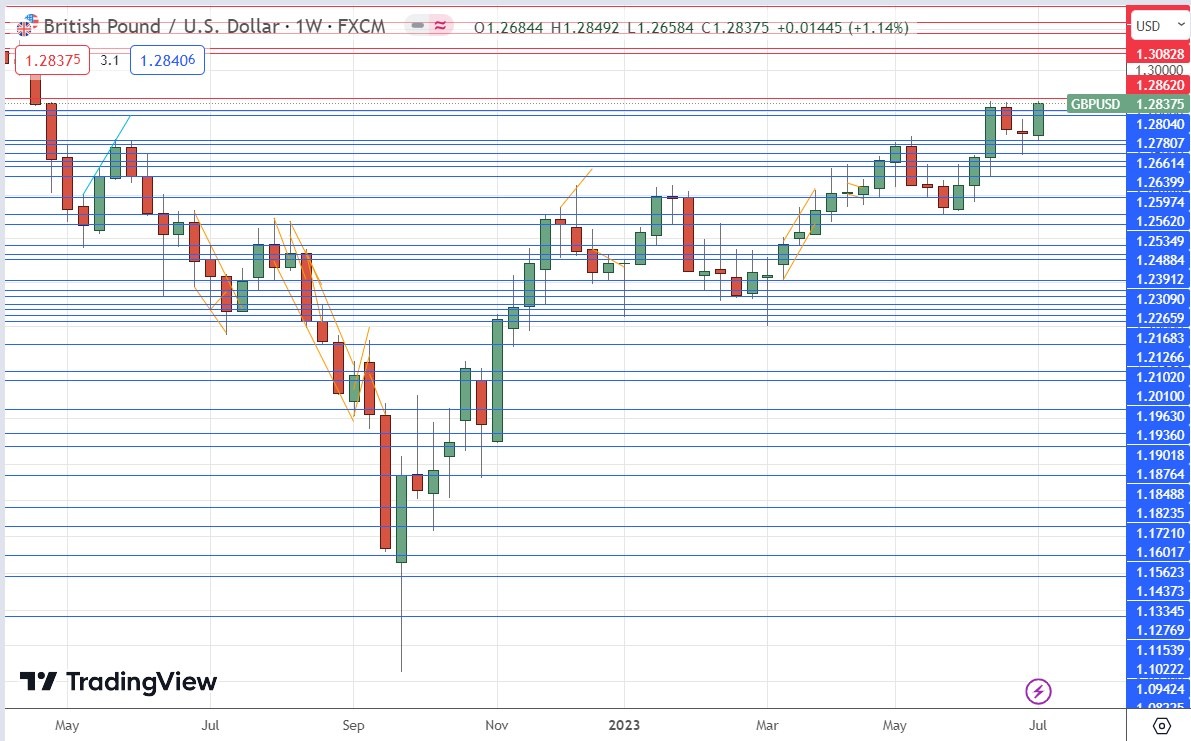
The GBP/USD currency pair rose strongly last week to make its highest weekly close since April 2022, and the week’s price action also made a new 15-month high price.
As we see short-term bearish momentum in the US Dollar, despite the medium-term sideways consolidation pattern in the Dollar Index, I think there is a good opportunity to enter a long trade here and hope that we are seeing a bullish breakout.
The Pound is relatively strong, and the only important data we are getting this week regarding the Pound is UK GDP data, which is unlikely to be enough to generate a significant movement, so being long just on the technical picture and the relatively hawkish Bank of England pressured by still-high inflation should be a wise move.
USD/JPY
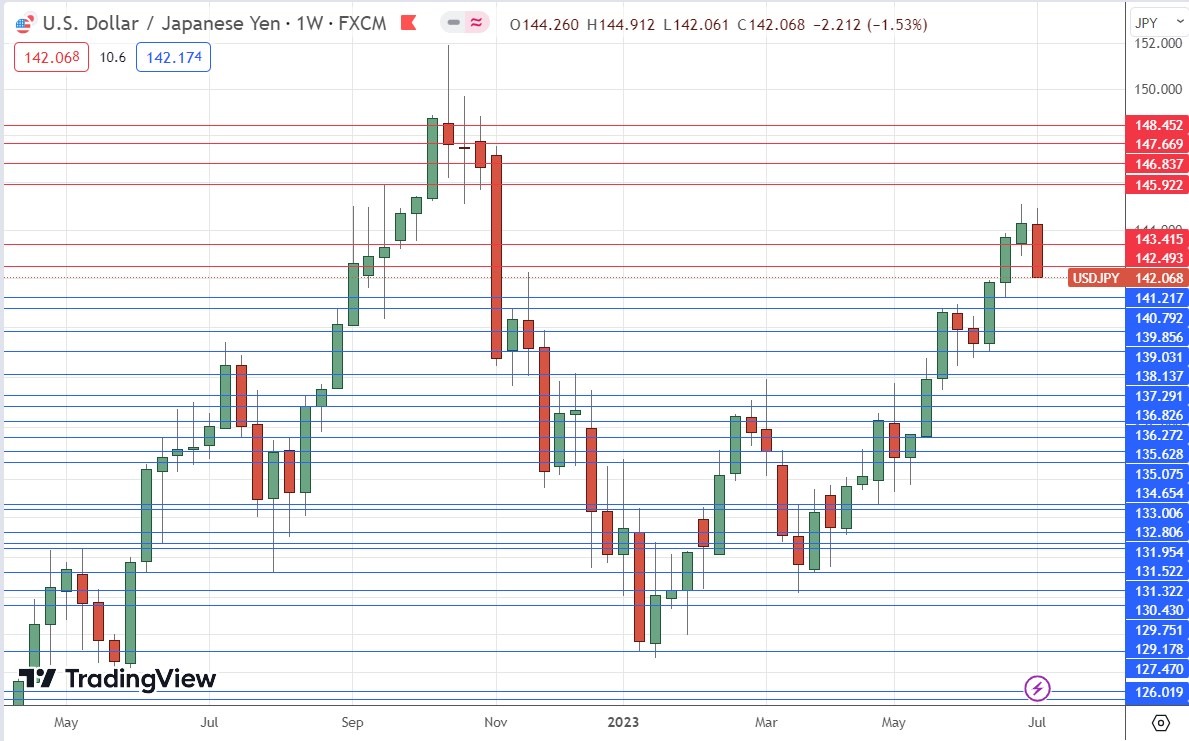
The USD/JPY currency pair fell quite hard last week from its recent 7-month high just above ¥145. The fall from that round number feels significant, as although we still have a valid long-term bullish trend, it is somehow hard to see the price making a new high soon.
We see the Yen being the biggest gainer last week while the US Dollar was the weakest major currency, emphasizing how the selloff here was at the heart of the Forex market.
We see short-term bearish momentum in the greenback which could well continue, so I expect that the price here will continue to fall. What looks likely to be key technically is the support level I have identified at ¥141.22. If we get a daily close below that level, I will see the bullish trend as over.
Bitcoin
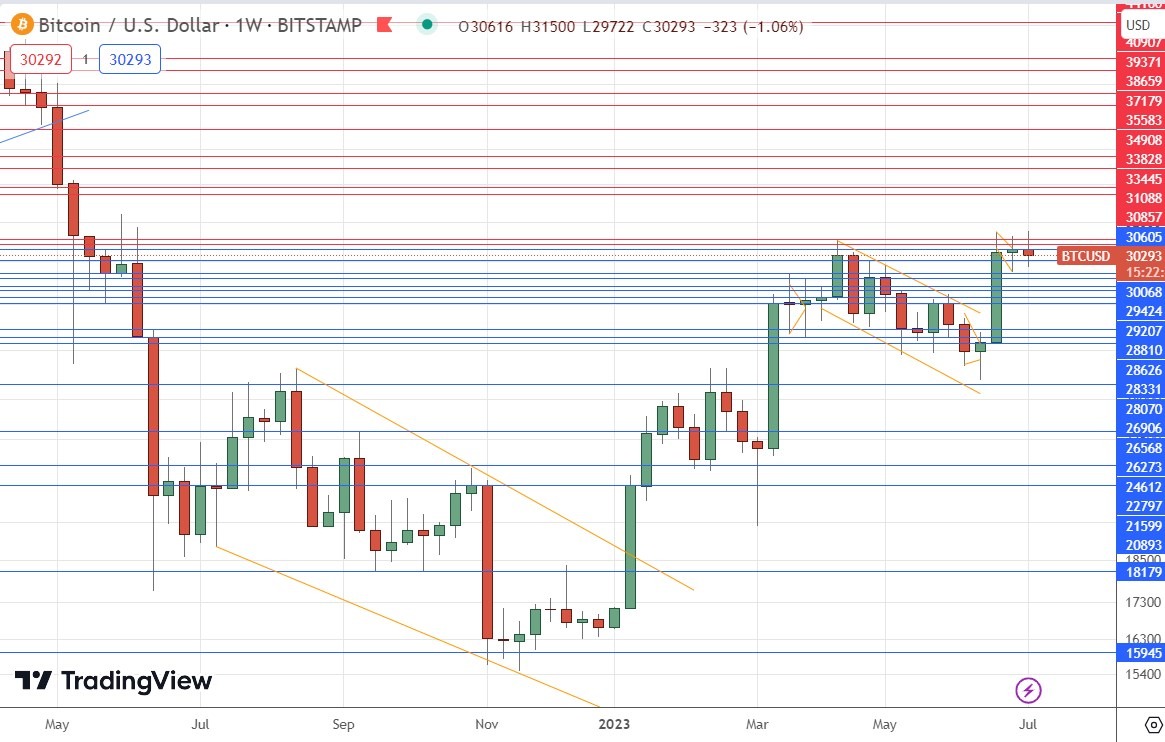
Bitcoin has again failed to decisively break above the key resistance level which is very confluent with the round number at $31k.
This is starting to look more like a major bearish reversal, but the price action is quite narrow with a small bearish pin bar printed last week. Whatever happens, it does look likely that Bitcoin has arrived at a pivotal point.
Odds in favor of a reversal may be a bit higher, as the earlier rise was partly triggered by the increasing likelihood of regulators approving Bitcoin ETFs in the USA, but the SEC has just expressed some caution about this, which may push the price down.
If Bitcoin ETFs start to look more realistic and regulators soften their stance, and we get a daily close above $31k, I will see Bitcoin as a buy, as the price will have room to rise as high as $33,445 before meeting any key resistance levels.
Cocoa
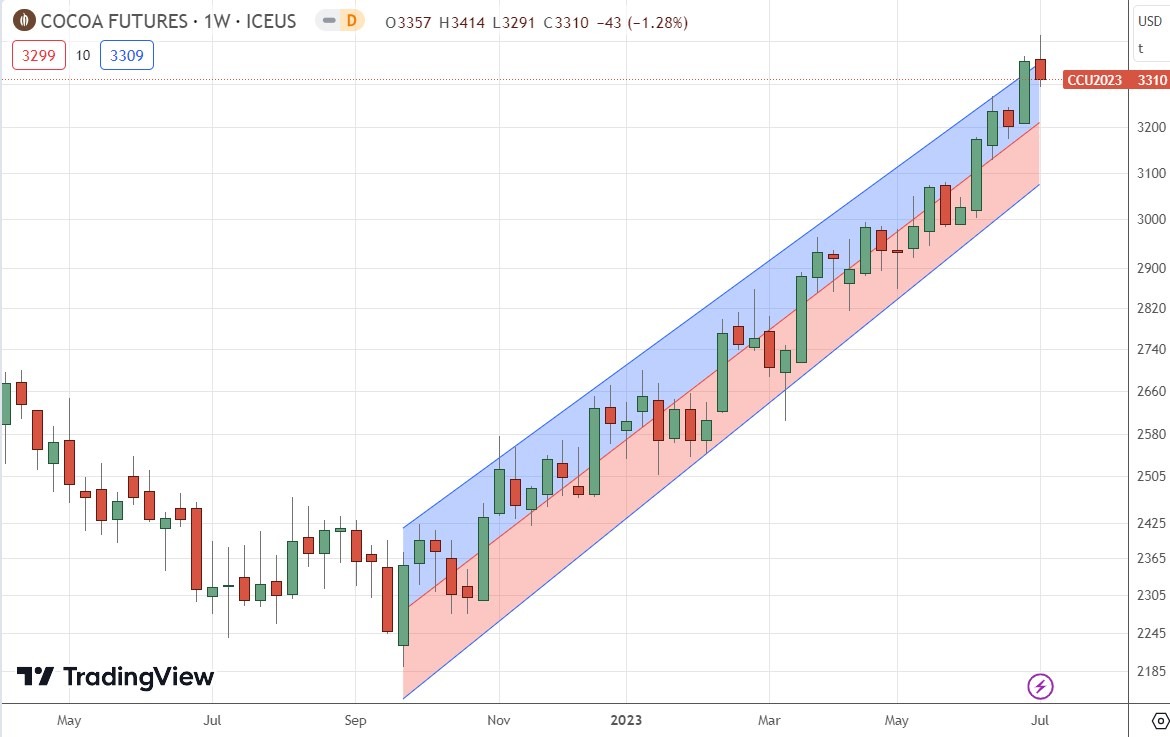
The price of Cocoa has been advancing strongly for a long time – since October 2022 – with a strong and predictable bullish trend. The price has risen by approximately 50% during this period, which is a large rise.
The Cocoa futures price chart below shows a linear regression analysis study applied to the trend since October, showing the price action is very predictable and has remained within the regression channel. This can be suggestive of a persistent trend.
Despite this, the price fell last week, but not by enough to be of strong bearish significance. However, it may be wise to wait for a consolidation and bullish breakout before entering a new long trade so as not to “catch a falling knife”.
There is strong global demand for cocoa and problems with some crops in Africa which are helping to drive the price higher.
Bottom Line
I see the best trading opportunities this week as:
- Long of the USD/JPY currency pair following a firm bullish bounce at ¥141.22.
- Long of Bitcoin after a daily close above $31k if a major Bitcoin ETF is approved.
- Long of the NASDAQ 100 Index following a daily close above 15297.2.
- Long of the GBP/USD currency pair.
Ready to trade our weekly Forex analysis? We’ve made a list of the best brokers to trade Forex worth using.
