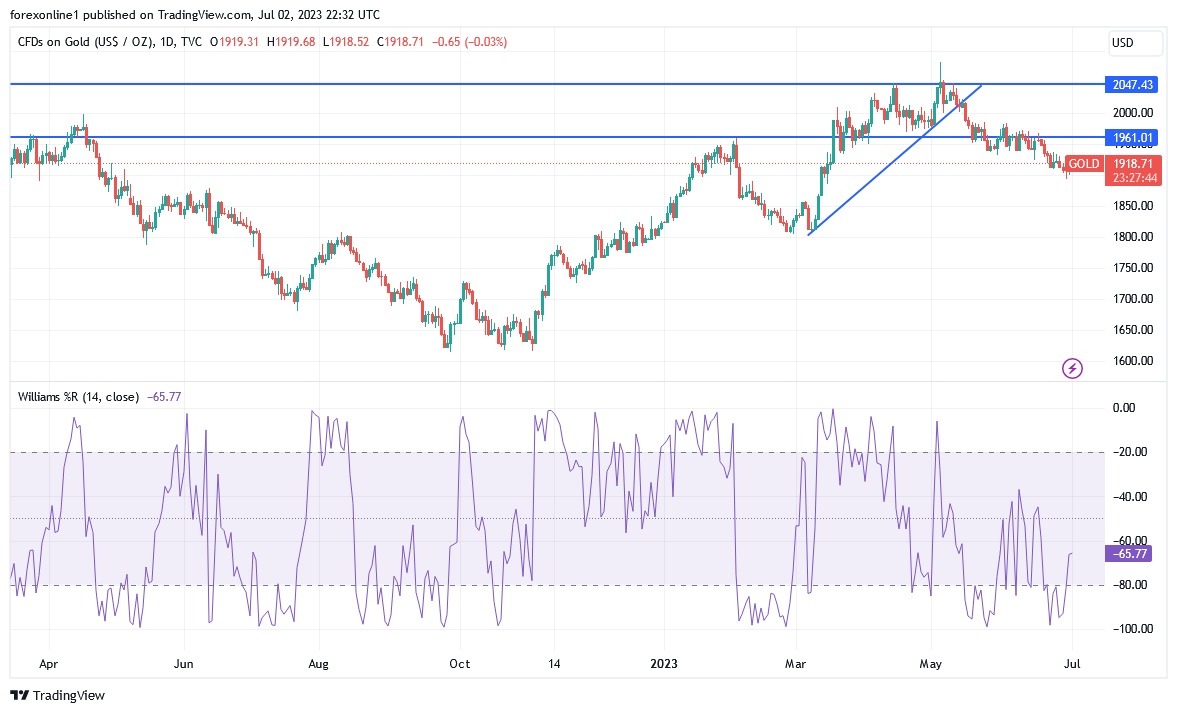
- The US dollar recently recovered with positive momentum from expectations of raising US interest rates, causing downward pressure on gold, which retreated to the $1893 support level last Thursday, which is the lowest price level in more than three months, and settled around $1920 an ounce at the time of writing.
- According to the performance in the last two sessions, the gold price rose now to trade above the 100-hour moving average line.
- As a result, it appears that the gold price is about to break the excessive levels at the 14-hour RSI peak.
According to the performance on the daily chart below, the price of gold moved towards the support level of $1885 an ounce, and below it pushes the technical indicators toward strong oversold levels, and the price may move towards new buying levels.
On the economic side, XAU/USD is trading affected by the results of recent economic data. The quarterly Tankan Business Confidence compiled by the Bank of Japan showed an improvement for the fifth consecutive quarter, from June last year, with the main indicator number rising by 3 points to +23. On the other hand, Wall Street indices ended a winning week last week, as the S&P 500 rose 1.2% to 4,450.38, its highest level since April 2022. The Dow Jones Industrial Average rose 0.8% to 34407.60 and the Nasdaq Composite jumped 1.4% to 13,787.92.
Trading in the US was closed for half of the day Monday and all of Tuesday due to the Independence Day holiday.
In general, investors hope that price increases will subside enough for the Federal Reserve to soon halt its increases in US interest rates. This may mean less stress on the US economy and global financial markets. Friday's report showed that the Fed's preferred measure of inflation eased in May. It also said that consumer spending growth slowed more than expected. And if there are fewer dollars chasing purchases, that could remove more pressure on inflation.
The Fed actually raised US interest rates by 5 percentage points from almost zero early last year. Wall Street traders have cut their bets that the Fed could raise interest rates twice again this year, with the majority betting the Fed funds rate will be only 0.25 percentage points higher at the end of 2023, if all, according to data from CME Group.
On the other hand, yields in the bond market turned bearish on Friday after the release of economic data. The 10-year Treasury yield fell to 3.82% from 3.87% just before the report was released. It helps determine rates for mortgages and other important loans. The S&P 500 ended its sixth winning week in the last seven weeks of June and its best month since October. And the index's roughly 16% gain in the first six months of the year is better than in 16 of the last 23 full years.
Gold Technical Outlook:
In the near term and according to the performance of the hourly chart, it appears that the gold price is trading within an ascending channel formation. This indicates a significant short-term bullish bias in market sentiment. Therefore, bulls will target extended gains around $1927 or higher at $1936. On the other hand, bears will look to pounce on profits around $1910 or lower at $1900 an ounce.
In the long term and according to the performance on the daily chart, it appears that the gold price is trading within a bearish channel formation. This indicates a long-term bearish bias in market sentiment. Therefore, bears will look to extend dips around $1869 or lower at $1803 an ounce. On the other hand, the bulls will look to pounce on attempts to rebound higher around $1983 or higher at $2049 an ounce.
 Ready to trade today’s Gold prediction? Here’s a list of some of the best XAU/USD brokers to check out.
