Natural gas is an important energy source that is used for heating and electricity production, and its markets have recently been marked by a lot of noise and uncertainty. The largest component of natural gas is methane, and the U.S. Environmental Protection Agency estimates that methane emissions from natural gas and petroleum systems were the source of about 33% of total U.S. methane emissions in 2020 [1].
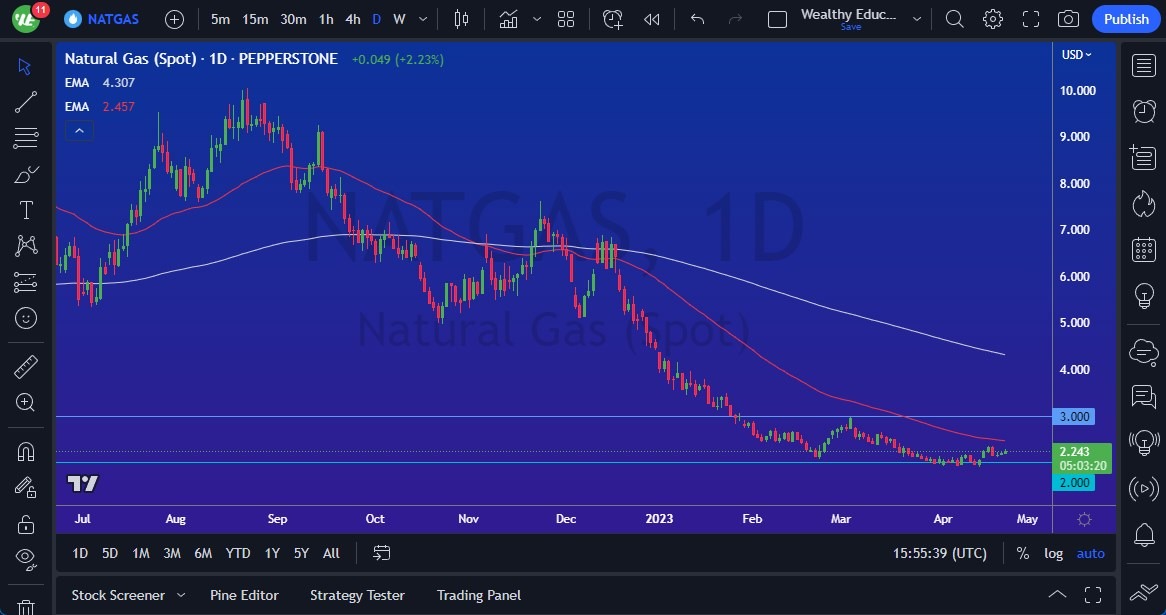
Currently, natural gas markets are trading between the $2.00 level on the bottom and the $3.00 level on the top, and the 50-Day EMA above is a trend-defining indicator that traders are closely watching [10]. If the market breaks above the 50-Day EMA, then it could go looking to the $3.00 level above, which is a psychologically significant figure, and an area where we recently had seen some selling pressure. However, at this point, it seems unlikely that we will see such a bullish sign anytime soon.
Furthermore, we are currently at the beginning of the worst time of year for natural gas, which is used for a lot of heating. Additionally, the global economy is not doing well, which drives down the value and demand for natural gas since a lot of electricity is produced via natural gas at plants.
Pay Attention to the 50-Day EMA
- Short-term back-and-forth action is anticipated as the market tries to figure out what to do with itself.
- All things being equal, the market should be in the $1.00 range throughout spring and summer in the northern hemisphere.
- If the market breaks down below the $2.00 level, then the $1.80 level is the short-term support level, and it would probably be on the floor throughout the next several months [9].
In summary, natural gas markets are currently trading between the $2.00 level on the bottom and the $3.00 level on the top. The market is trying to figure out whether or not that range will be the “summer range,” but it should be in the $1.00 range throughout spring and summer in the northern hemisphere. The 50-Day EMA is a trend-defining indicator that traders are closely watching, but it seems unlikely that the market will break above the $3.00 level anytime soon. However, if it did – that could lead to a massive, short squeeze.
Potential signal: When trading this market, look at the 50-Day EMA just above as a short-term ceiling to take advantage of. $0.10 stop losses are possible, as the volatility has crumbled. Aiming for $0.20 gains continues to be the way forward. A simple “fade the rally” trade system seems appropriate.
Ready to trade our free trading signals? We’ve made a list of the top 10 forex brokers in the world worth trading with.

