WTI Crude Oil (US Oil)
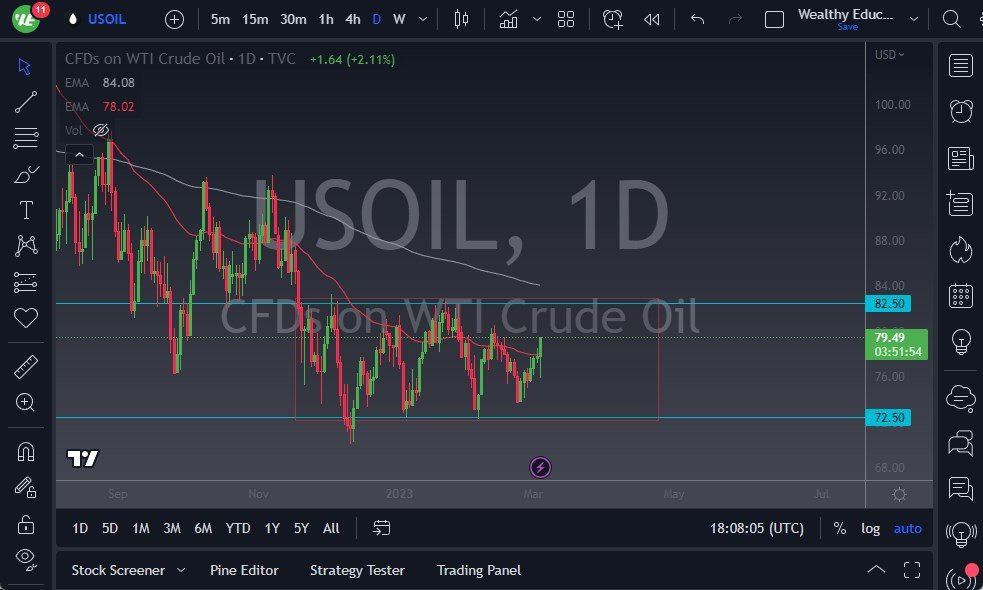
- During Friday's trading session, the West Texas Intermediate Crude Oil market initially dropped towards the $75 level before making a quick turnaround to show significant bullish activity and form a massive hammer.
- Although the market has managed to break above the 50-Day EMA, it remains within a consolidation rectangle, making it challenging to invest significantly.
- Swing traders will particularly struggle to find suitable entry points amidst the larger consolidation, while short-term traders may find potential opportunities on shorter time frames.
The $72.50 level is expected to provide support, having previously attracted multiple buyers. On the other hand, the $82.50 level presents a significant resistance point, having experienced significant selling pressure in the past. Additionally, it's worth noting that the 200-Day EMA sits just above the consolidation, further complicating the market's direction.
Brent (UK Oil)
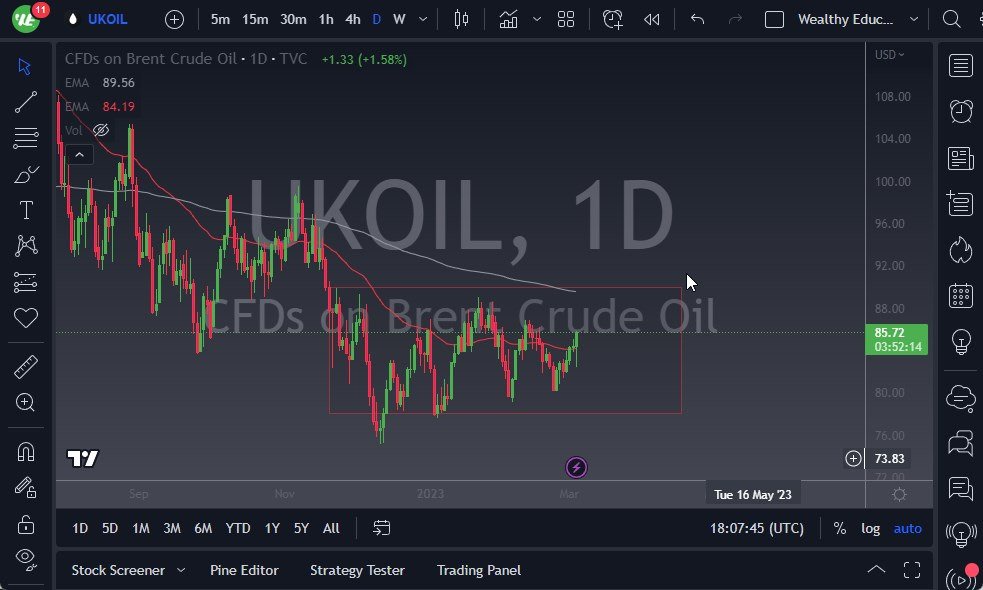
- On Friday's trading session, Brent crude oil also started with a drop before rebounding to demonstrate some bullish activity.
- Despite the lack of significant progress, crude oil has shown remarkable resilience in the face of global uncertainty, leading some to suggest that there could be some accumulation taking place.
The $89.20 level marks the position of the 200-Day exponential moving average, while the $90 level represents the top of the overall resistance barrier. A break above the $90 level could open the market up to a move towards the $97.50 level. However, if the market turns around and starts to fall, the $77.50 level is expected to provide support, having served as a reliable support level in the past. Overall, the market remains in the middle of the range, making it challenging to play significant trades in this market. That being said, if you are short-term trader, you may look at the range bound system on small time frames, but beyond that it’s going to be difficult to make any headway.
However, it’s worth noting that oil at least hasn’t fallen apart during this uncertain time, so I think that the oil market will be very strong, perhaps in the middle of the year, but right now I don’t have any interest in trying to guess which direction we are going. I will trade it on the outer edges of the range, but in this middle area I’ve got no time to take a “50-50” trade.
Ready to trade WTI/USD? Here are the best Oil trading brokers to choose from.


