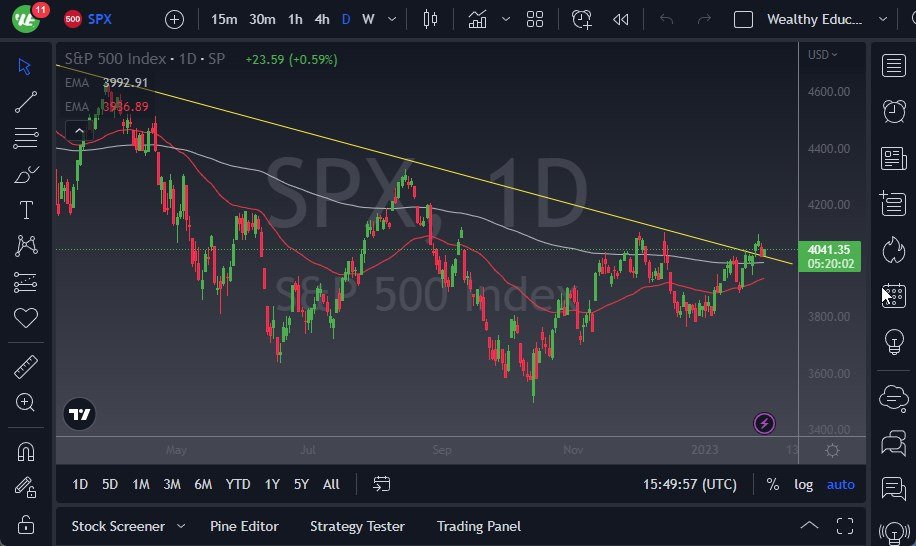
- The S&P 500 Index has been positive during the trading session on Tuesday, as the FOMC Meeting begins.
- Ultimately, it’ll be interesting to see of this plays out, due to the fact that the markets will probably be very noisy after the FOMC meeting, the interest rate hike, the statement, and most certainly the press conference.
- After all, this is all about whether or not the Federal Reserve is going to continue to liquefy the markets and hand Wall Street cheap money.
S&P 500 Today's Trading Outlook
The 200-Day EMA sits underneath the trendline, and therefore has a lot of influence on this market. It’s essentially near the 4000 level, and of course the 4000 has a certain amount of psychology attached to it as it is a large, round, psychologically significant round figure. Looking at this chart, you can also make an argument that the 50-Day EMA is trying to turn toward the 200-Day EMA, so from a technical analysis standpoint, it does look like the market is starting to break out and go much higher. It’ll be interesting to see on this plays out, but I think at this point, the real tell will be by the end of the week as we will not only gotten through the press conference after the FOMC meeting, but we also have the jobs number on Friday that will obviously have an influence as well. We can break above the 4100 level, then I think the market is truly broken out and is clear of a lot of noise.
On the other hand, if we break down below the 50-Day EMA, it’s very likely that we would threaten the 3900 level, and then more likely than not after that is an opportunity to get down to the 3800 level. The 3800 level being broken below to the downside would open up quite a bit of selling pressure down to the 3600 level. Because of this, I think you need to be very cautious about the markets, because if we do chop through a couple of support levels, then it’s likely that we collapse. I think this week will be very crucial, because quite frankly the market continues to completely ignore the Federal Reserve. If they can’t get their message across finally, I suspect that we will see “tighter for longer” due to the fact that the Federal Reserve continues look at inflation as still far too strong, and higher stock market pricing does nothing to help the psychology of consumers to slow down.
Ready to trade our S&P 500 analysis? Here’s a list of some of the best CFD trading brokers to check out.

