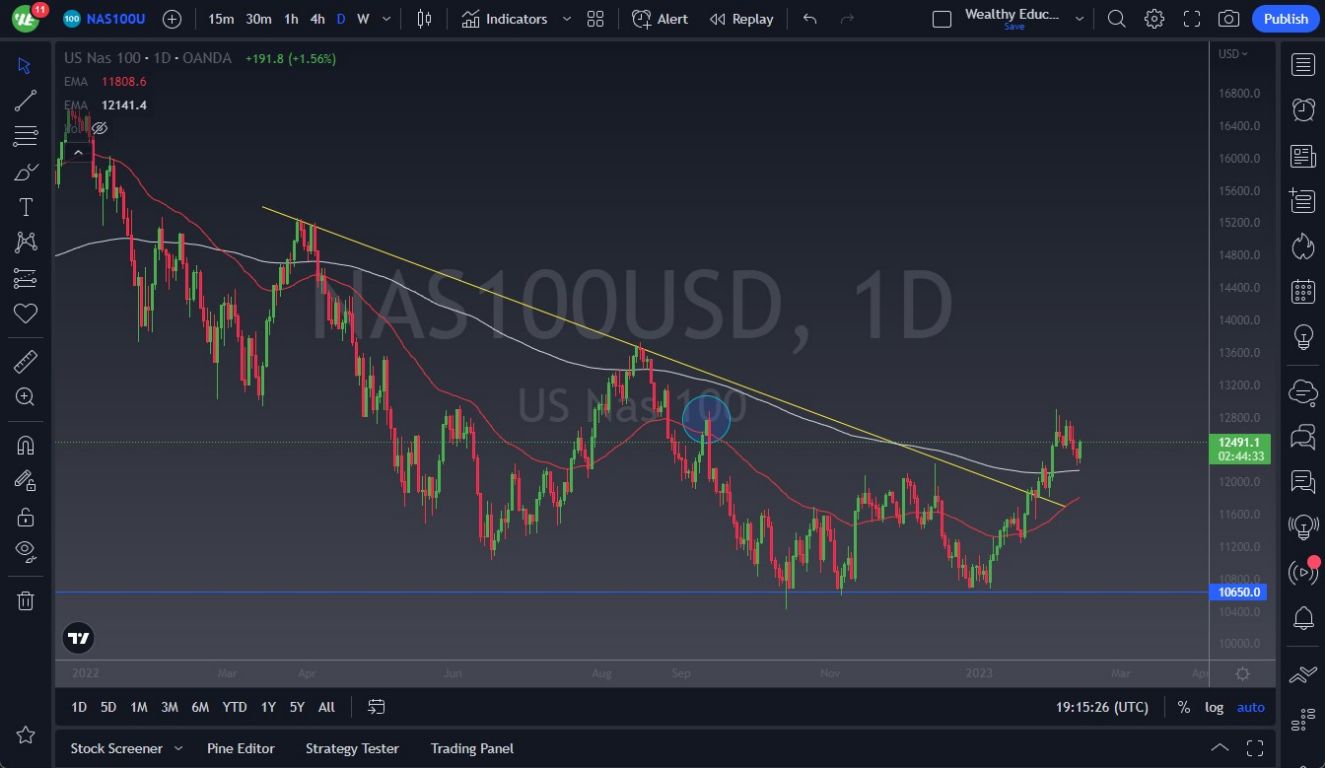
- The NASDAQ 100 Index has rallied quite nicely during the trading session on Monday, breaking above the top of the Friday candlestick.
- The 200-Day EMA sits just below and attracts a lot of attention.
- Because of this, it’s probably not a huge surprise that we’ve seen a better rally, and of course interest rates could come into play as well.
NASDAQ Building Bullish Flag
Beyond that, we also have the earnings season going on currently, and that obviously has input as to where we go next. If we were to break down below the 200-Day EMA, then it’s possible that we could go down to the 12,000 level. After that, then we have the possibility of going down to the 50-Day EMA, which is a little closer to the 11,820 level. The market looks as if it is building a bit of a bullish flag, and therefore I think a lot of people are starting to look to see whether or not we can break out. However, if you look at the chart you can see that I have a blue circle that is sitting right around this area as well, where we had seen a lot of selling pressure. The size of the candlestick is reasonably bullish, but it’s worth noting that there are several shooting stars that had formed last week, which shows a lot of negativity.
The market continues to be very noisy, and I just don’t see how that changes anytime soon. The market participants continue to try to figure out whether or not the Federal Reserve is going to tighten the monetary policy, or if they are finally going to acquiesce to Wall Street. Wall Street always assumes that the Federal Reserve is going to give them cheap money, under the guise that it helps the economy. However, we have to worry about inflation, which is still extraordinarily high, despite the fact that it has been slowing down. With that being said, I anticipate that volatility gets worse, not better. All things being equal, we need some type of impulsive move to continue the upward momentum, or I suspect that we will slump in the short term, which could be an opportunity for buyers to pick up the contract cheaply, or it could be the beginning of yet another rollover in this market.
Ready to trade the NASDAQ 100 Index? Here are the best CFD brokers to choose from.

