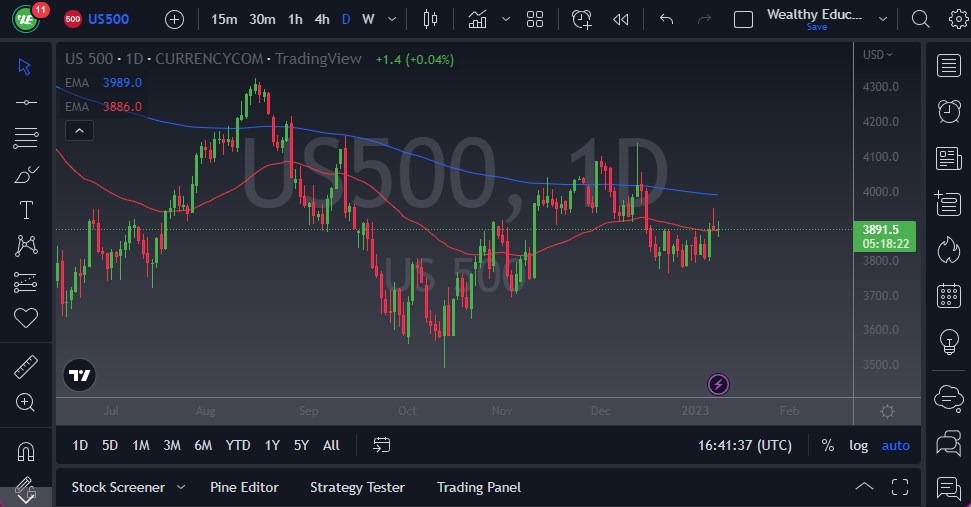
- The S&P 500 has gone back and forth during the trading session on Tuesday, as Jerome Powell had a speech, essentially reiterating everything he’s been saying for quite some time.
- That being said, Wall Street has completely ignored him yet again and therefore is trying to find reasons to have that bullish narrative come back into the picture.
- The 50-Day EMA is very commonly followed, so the fact that we are hanging around it should not be a huge surprise.
If we break down below the bottom of the candlestick for the trading session on Tuesday, then it’s very likely we could go down to the 3800 level. That’s an area where we had seen the bottom of this consolidation, and the fact that the candlestick from the Monday session ended up being a shooting star does lead some credence to the idea that we may stay in that range. On the other hand, if we were to break above the top of the shooting star from the Monday session, then we could make a move to the 4000 level, which is where the 200-Day EMA currently resides. That’s not to say that I think it’s going to happen, just that breaking above the top of that shooting star would be a very big sign of strength. Breaking above the 4000 level would be very bullish as well, but I think that is putting the cart before the horse.
Waiting for the CPI Numbers
On the other hand, if we were to turn out a breakdown to reach the 3800 level, then it opens up quite a bit of shorting pressure. This is even more important for the area due to the fact that we had a massive green candlestick during the month of November from just below that level, and it does suggest that there should be plenty of support in that general vicinity. Breaking down below there really opens the floodgates for lower pricing, but you should keep in mind that the market appears as if it’s going to ignore Jerome Powell and looked toward the CPI numbers coming out on Thursday.
If they are hotter than anticipated, we could see a flush yet again. On the other hand, if they are lower than anticipated, we could see a little bit of a short-term pop, although it’s probably worth noting that the CPI numbers are going to be a far cry from the 2% inflation that the Federal Reserve is aiming for.

Ready to trade the S&P 500 Forex? We’ve shortlisted the best CFD brokers in the industry for you.
