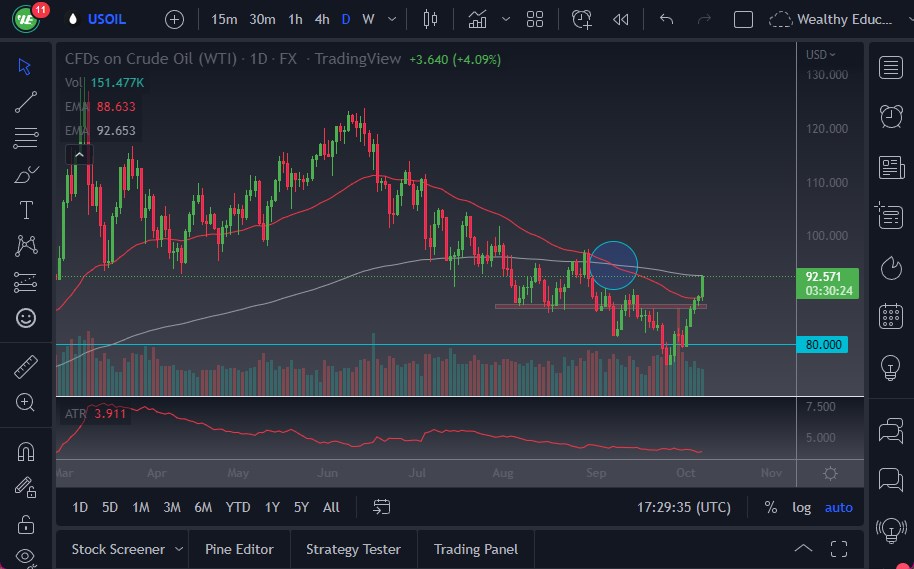
- The West Texas Intermediate Crude Oil market rallied significantly during the day on Friday, breaking above the $92 level and touching the 200-Day EMA.
- At this point, we have to ask whether or not the downtrend is starting to unravel because OPEC has decided to cut supply by 2 million barrels a day.
- That obviously puts upward pressure on the price of crude oil, so I think at this point in time we will have to pay close attention.
Will the Crude Oil Break Above the $95 Level Soon?
The recent move in this market has been quite aggressive, so it’ll be interesting to see if we can continue with the necessary momentum to continue going higher. If we break above the $95 level, then it’s likely that we could go looking to the $100 level. One thing is for sure, the market is a little overextended at this point, so I would anticipate some type of pullback. The question at that point in time would be whether or not the pullback is something that people will be willing to step in and buy.
The size of the candlestick for the Friday session should give you a bit of a heads up as to a little bit of follow-through, but I think at this point in time the most important indicator that I see on the chart will be the 50-Day EMA, which is at the bottom of the candlestick for the session on Friday. Pullbacks to that area should see a significant amount of support. If they do not, then I think oil is in trouble and we continue to drop from there. The market breaking back down could be a result of concern about demand destruction, so I think at this point in time we will see more of a push-and-pull type of situation between OPEC and whether or not there will be enough demand out there in a slowing global economy.
The Friday jobs number was a little bit hotter than anticipated, so perhaps that’s part of what we are seeing here as well, the idea that enough people are working in the United States to continue to drive the value of oil higher. At this point, I think the only thing you can probably count on is a lot of volatility, so you may want to pay close attention to the OVX, which is the oil volatility index.
Ready to trade WTI/USD? Here are the best Oil trading brokers to choose from.

