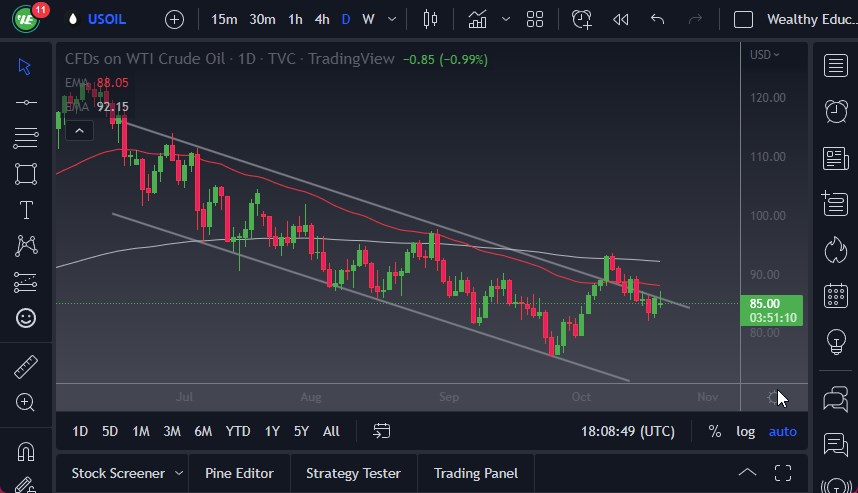
- The West Texas Intermediate Crude Oil market initially rallied on Thursday but has given back gains to form a less than attractive candlestick.
- By doing so, we ended up forming a shooting star right out the previous downtrend line, and it looks to me like we are ready to go lower.
- If we break down below the lows of the week, that opens the possibility that we go down to the $80 level.
This is a very interesting market now, because the recent cutback of production by OPEC of 2 million barrels per day seems to have had minimal impact. This shows just how concerned people are about the global economy, as the global economy runs on crude oil. The idea of course being that if there is a lot of economic activity, there will be a lot of shipping and transportation, which of course demands a lot of crude oil.
Waiting for a “Fade the Rally” Situation
Now that we have failed at the 50-Day EMA, it suggests that we are going to continue to see more of a “fade the rally” type of situation, at least in the short term. However, if we were to break above the 50-Day EMA, that cuts in this market higher. In that move, I would be looking for crude oil to go looking toward the 200-Day EMA, which is roughly $92 or so. On the downside, we could be looking at a move down to the $80 level if we continue to see a lot of negativities.
You can see that I have a channel drawn on the chart that we had thrown over previously, and now it looks like we are trying to jump back into it. If it’s going to be the case, we should continue to see a lot of negativities but it must be said that oil has been absolutely crushed over the last several months. If there is a lot of fear out there, oil is going to struggle to catch a serious longer-term bid. If you read my analysis yesterday, you know I talked about the possibility of going sideways, and this candlestick does suggest that the very least that we are not going to be going higher in the short term based upon price action.

Ready to trade our WTI Crude Oil analysis today? We’ve made a list of the best Forex Oil trading platforms worth trading with.

