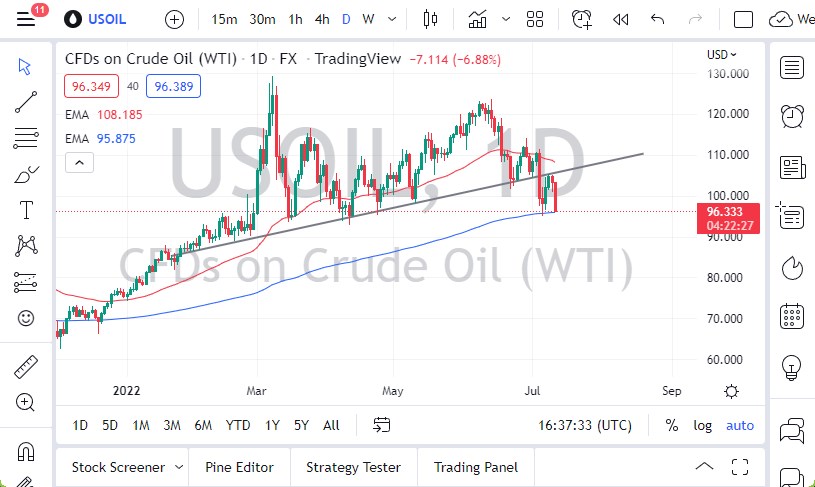
The West Texas Intermediate Crude Oil market has fallen rather hard during the trading session on Tuesday to threaten the 200 Day EMA. The 200 Day EMA is a major indicator that people pay close attention to in order to determine whether or not we are in an uptrend or a downtrend.
If we break below the bottom of this indicator, it is in theory going to be a downtrend. I think it would cause a lot of algorithmic trading to kick-off, so it’ll be interesting to see how negative the market could get. It’s also worth noting that the candlestick is rather large, so therefore it suggests that there is still plenty of conviction behind the short side. Beyond that, the market is trying to close the very bottom of the range, which is typically a sign that we get a bit of follow-through. After all, if you are comfortable going home overnight short of the market, that means you have real conviction.
If the market were to turn around and take out the top of the candlestick, then it would fight the $105 level. Breaking above the $105 level could open up the possibility of the 50 Day EMA being challenged. Anything above that would be very bullish, and I think to signify that the market is ready to go back into an uptrend. However, a lot of people are starting the price in recession, which means that there should be a lot less demand for crude oil going forward. If that is in fact going to be the case, then I believe oil has much further to drop.
The US dollar has been rather strong, so that does not help the situation either. However, in the environment that we find ourselves in, this is more or less going to be a situation where we are paying attention to economic growth more than anything else when it comes to giving some type of analysis for this market. Expect a lot of noisy behavior, but I would be very cautious about my position size, as the volatility is going to probably increase, not settle down. At this point, we are seriously threatening the previous uptrend. The more inflation that we see, the more likely it is that people start to worry about a major recession.

