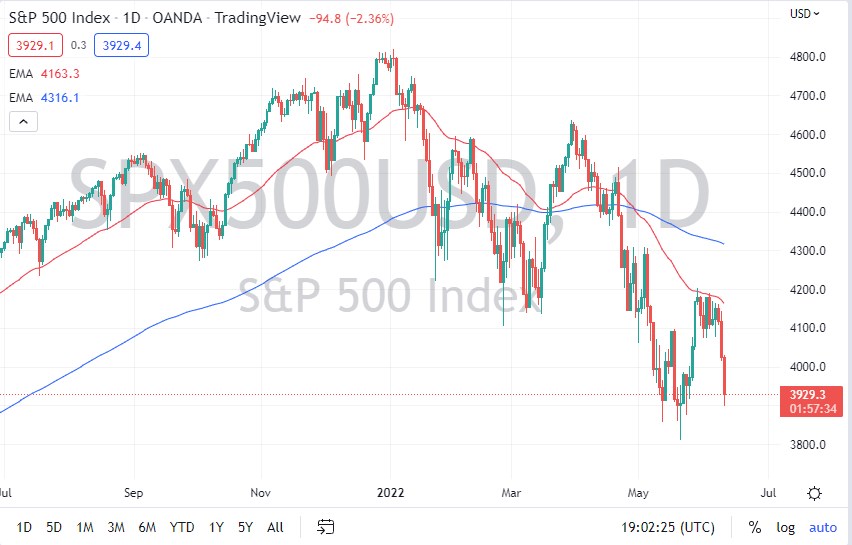
The S&P 500 fell rather hard on Friday as inflation numbers came out much stronger than anticipated, destroying the narrative that Wall Street was trying to put together. After all, the traders on Wall Street were hoping that inflation had peaked, but based on the number on Friday, we are far from that being the case.
Furthermore, when you look at the candlestick for the trading session on Friday, it shows just how negative things are. It looks as if we are going to threaten the 3900 level, which is a large, round, psychologically significant figure and an area where we had seen support. If we were to break down below there, then it opens up the possibility of a move to the 3800 level. The 3800 level has been the scene of a major bounce, so if we were to break through there, it’s likely that the market would then go looking to the 3600 level.
If we do rally a bit at this point, there is plenty of resistance above, not only at the 50-day EMA which recently had offered a significant amount of selling pressure. The 4000 level between here and there could be an area where we can have selling, right along with 4100. At this point, as long as the S&P 500 has to deal with the Federal Reserve tightening interest rates drastically, as well as running off the balance sheet, Wall Street will suddenly have to find itself working at making a profit instead of just throwing money at everything. This is what you are seeing currently, an unwinding of a massive bubble.
Ultimately, I think this is a market that will be noisy, but every time we rally, I’m looking for signs of exhaustion that I can start shorting. That’s what the last couple of weeks has been, and now it looks like we are ready to continue threatening to the downside. The 50-day EMA has spread quite far from the 200-day EMA, showing just how negative the trend is, and how much momentum it has. The last couple of candlesticks has been very negative and long, so that does suggest that there is going to be a significant amount of follow-through waiting to happen. Typically, if you close at the bottom of candlestick, it means that the market is comfortable being short, or at the very least uncomfortable buying.

