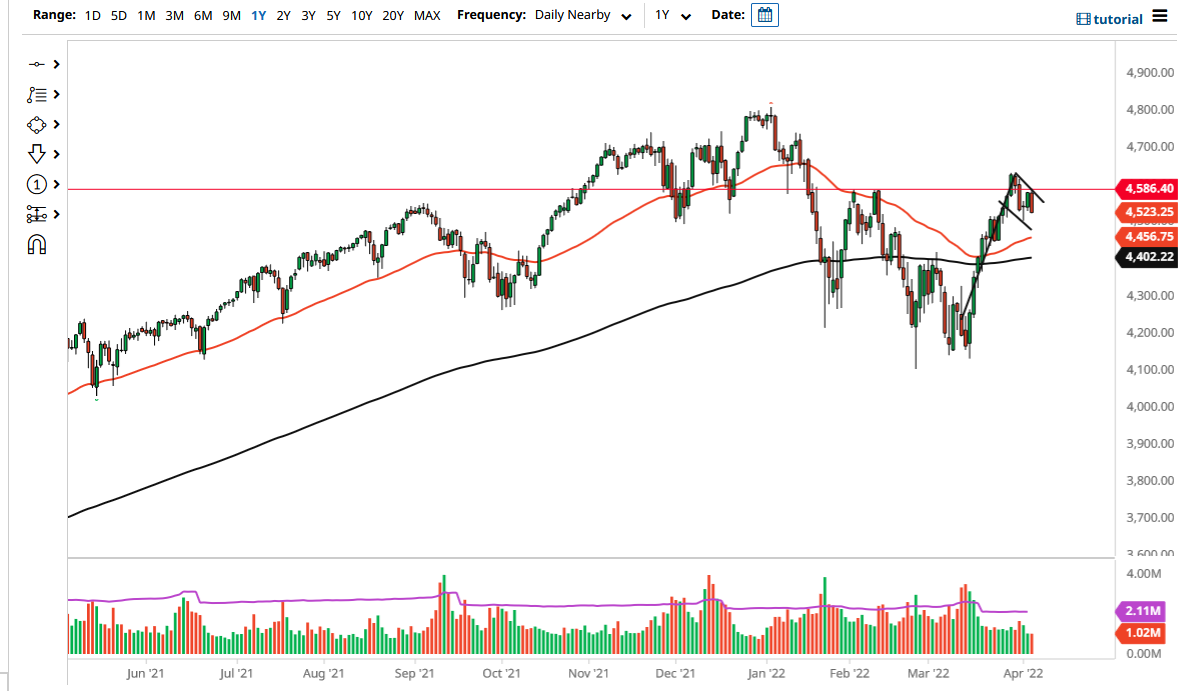
S&P 500 futures fell on Tuesday as the market has seen so much in the way of noise overall. This is a market that I think will continue to see noisy behavior, as there are a lot of uncertainties around the world. The S&P 500 is dealing with the idea of higher interest rates coming out of the United States, and it will perhaps weigh upon the index. The market has fallen from the top of the potential flag pattern, so I think it is only a matter of time before the buyers have to make a bigger decision.
If we were to break above the downtrend line of the flag, then it is obviously a bullish sign. The 4585 level is where we had previously seen a bit of a double top. This double top being broken to the upside then shows a continuation of the bullish pressure that could send this market higher. This would obviously open up the possibility of bigger games, but right now Wall Street has to decide whether or not interest rate hikes are going to continue to be something to fear.
Underneath, we have the 50-day EMA coming into the picture at 4456 and rising, so pay close attention to that area and see whether it would continue to offer support. If we were to break down below that level, then it is likely that the 200-day EMA near the 4400 level could be the next target to the downside. Breaking below there would then signify a downtrend yet again and could send markets scrambling. The market continues to see a lot of volatility, and probably the only thing that you will be able to count on is the choppiness.
As central banks around the world will continue to think about tightening, this will have a drastic effect on profits, and it is very likely that the S&P 500 still will think of this as “swimming upstream.” Ultimately, we need some type of impulsive and large candlestick to determine where we are going next. It certainly looks as if we are trying to build a bullish flag, but we need things to turn around rather quickly to get things moving in a positive manner. Remember, rallies during bear markets tend to be very vicious, and that could have been what we have just seen.

