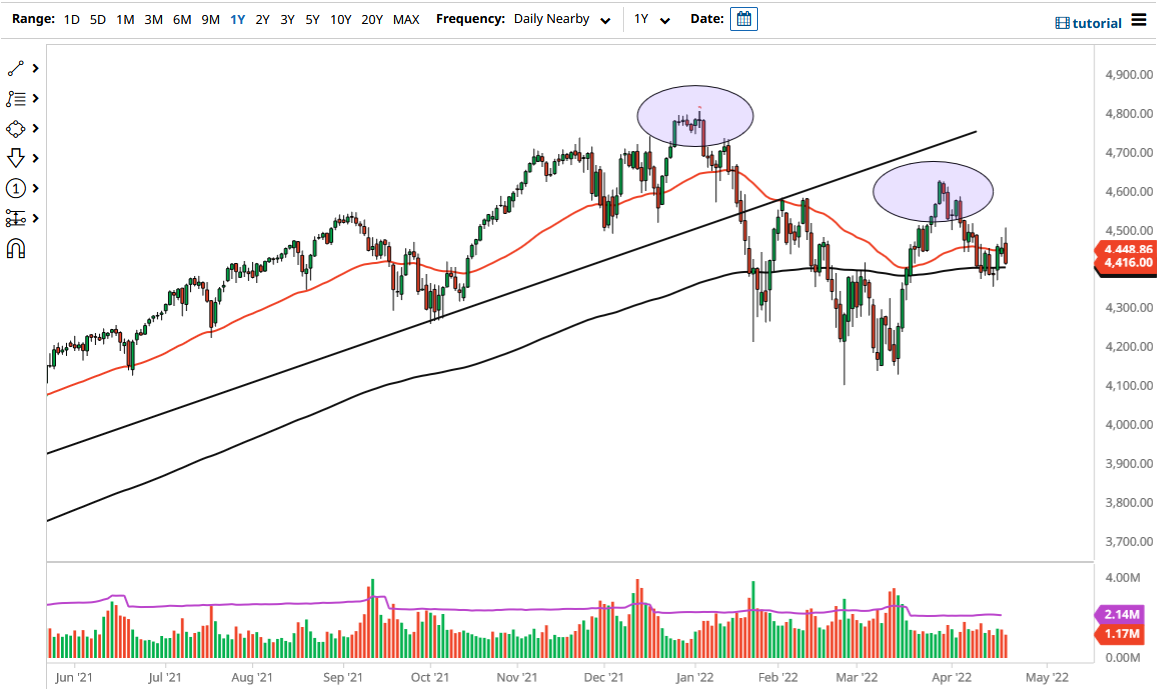
The S&P 500 initially tried to rally during the trading session on Thursday but got absolutely hammered later in the afternoon. By doing so, the 200 Day EMA is being threatened, and a breakdown below there then opens up the possibility of threatening the lows of the Monday session, and then sending this market much lower. That would be a huge reversal, and a market that quite frankly is living on borrowed time as it appears.
You can make an argument for a bearish flag be informed, but we have not broken through the bottom of it so is not necessarily a signal to get short quite yet. However, breaking down below that Monday candlestick would most certainly qualify as a selling signal, and could open up a move down to the 4300 level, possibly even the 4100 level over the longer term. This could be rather quickly, due to the fact that there seems to be a lot of concern out there, and that typically leads to massive and vicious moves to the downside.
It is obvious at this point that the 4500 level continues to cause major headaches, and therefore the market breaking above there would be a very bullish turn of events, not only because it would be a big figure being broken above, but it would also be a major reversal of the overall downward move of a ripping day.
The only thing I think you can count on at this point is going to be a lot of volatility, but quite frankly that is going to be the case with most markets, not just the S&P 500. The futures markets of course will take their cue from risk appetite in Europe and Asia, but the real question will be how will the underlying index behave? It is obvious that the Americans are paying close attention to so-called “Fed speak “, as there are numerous Federal Reserve officials giving speeches. Oddly enough, Wall Street does not believe that the Federal Reserve is going to tighten very quickly, while the Federal Reserve squares up and down that is going to. This sets up for an ugly turn of events, but clearly the stock market is hanging on by a thread most days, as it seems to take less to push lower than it does to push it higher.

