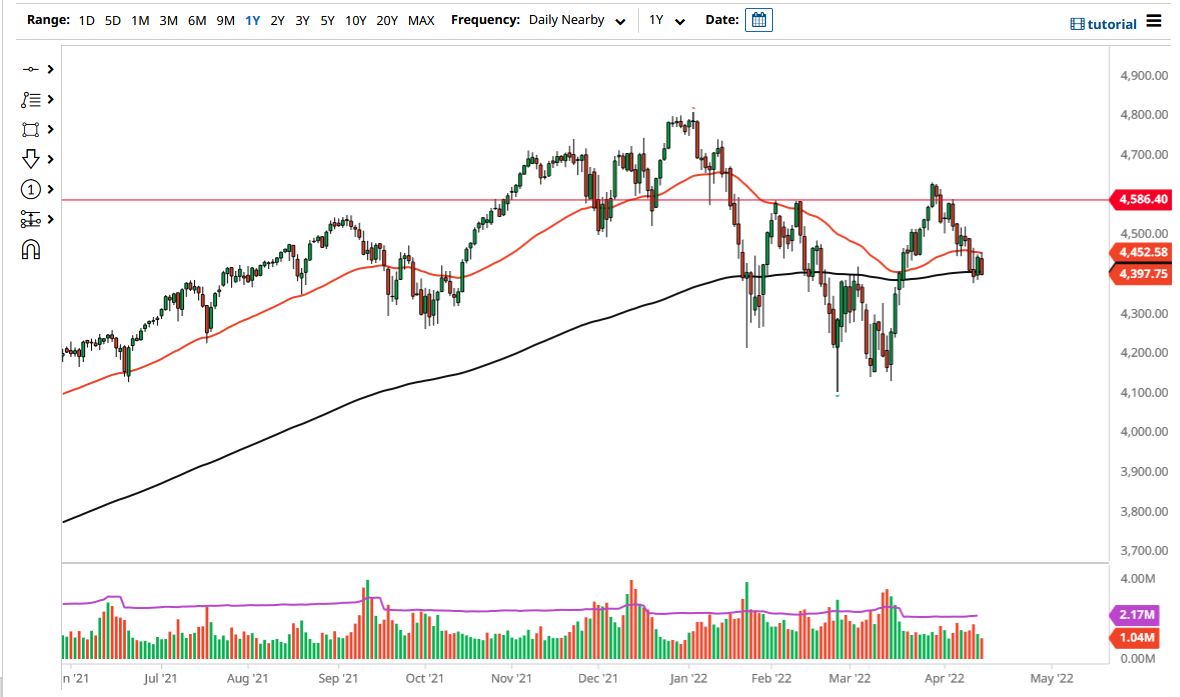
The S&P 500 initially tried to rally during the trading session on Thursday but gave back the gains as we tested the 50 Day EMA. The market squeezing between the 50 Day EMA and the 200 Day EMA indicators suggests that we are going to squeeze and perhaps have to make a bigger move. Because of this, it is possible that we are going to see inertia build-up, and then either break out or break the whole thing down.
My signal to start getting bearish again is that if we break down below the inverted hammer from the Tuesday session. At that point, I would anticipate that the market could go looking towards the 4300 level, possibly even the 4200 level. That is where we had bounced from, and quite frankly the nice rally that we have had is under threat due to the fact that there is a huge argument between Wall Street and the bond market as to what is going to happen with the Federal Reserve.
The question comes down to whether or not the Federal Reserve is going to fight inflation, or if they are going to support Wall Street. For the last 14 years, traders have learned that the Federal Reserve will come to the rescue, but now we have over 8% inflation in the United States, and that does change things. Not to sound too cynical, but the real tell was when Federal Reserve members had to stop day trading!
If we do rally, the 4500 level is going to be resistance, possibly after that the 4585 level. If we were to break above there, then you have to take a serious look at the possibility of “forming an inverted head and shoulders”, which is obviously a very bullish setup. In general, I do not like that idea, but there is no point in arguing with the market.
Pay close attention to the bond market, because if they continue to price in massive interest-rate hikes, it is only a matter of time before Wall Street capitulates. The coming recession is obviously going to have a major influence on the market as well, so you need to pay close attention to what is going on. For what it is worth, you need to pay close attention to the fact that the underlying fundamentals do not support a lot of bullish behavior.

