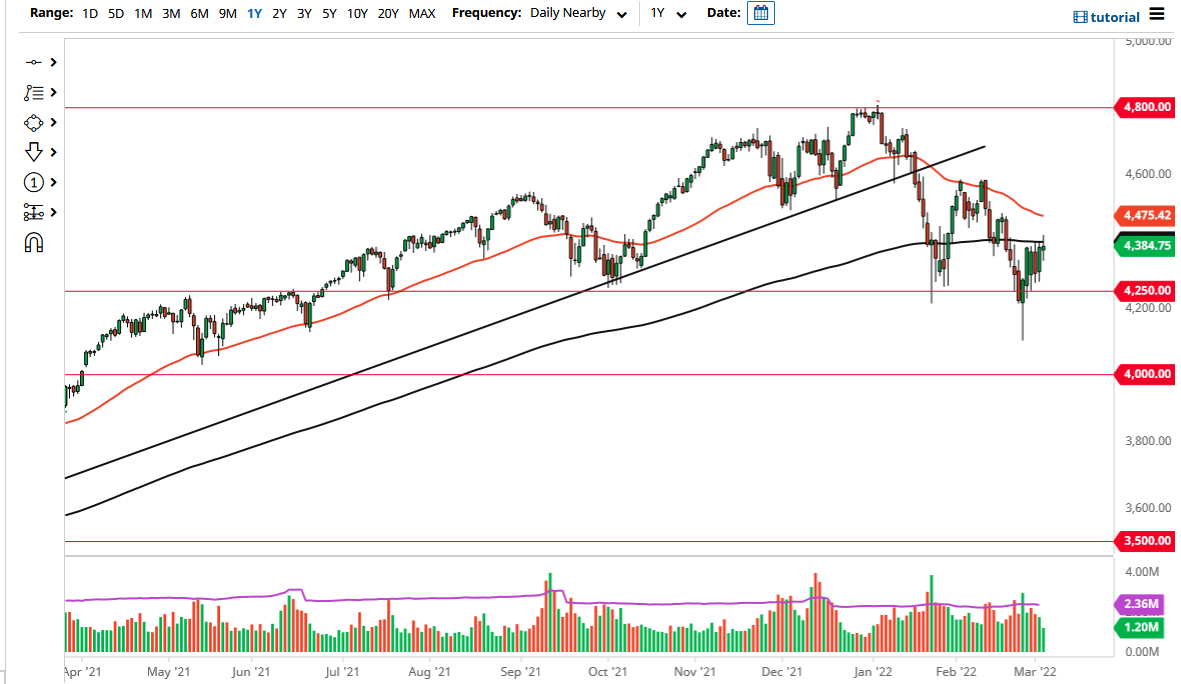
The S&P 500 has gone back and forth during the course of the trading session on Thursday as it looks like we are going to continue to struggle for momentum. The 200 Day EMA of course is an indicator that a lot of people will pay attention to, and therefore it does make a certain amount of sense that we have stalled in this general vicinity. I do believe that the market is going to continue to see trouble in general, and therefore it is difficult to get bullish. Quite frankly, the market is likely to see plenty of sellers above, especially as we have so many moving pieces at the same time that suggest negativity.
We have interest rates going much higher, which works against the value of stocks overall, and of course, has people looking towards the bond market for returns. Looking at the chart, you can see that the daily candlestick was less than impressive, so it is not going to be a huge surprise to see this market pullback. A pullback from here would simply be a reentry of consolidation that we had been in previously. Given enough time, I think we probably do exactly that, meaning that we could very well reach towards the 4300 level.
Furthermore, you have to keep in mind that in the environment that we find ourselves in, it is difficult to imagine that people want to keep risk on over the course of the weekend when geopolitical issues could send negative headlines across the wires before we reopen. That could lead to massive losses at the open for traders, so at this point, I would anticipate that by the time we end the Friday session, there will be a lot of people trying to close out positions.
The 4250 level underneath should continue to be an area of potential support, so pay close attention to that region. Ultimately, if we break down below there then I think we go looking towards 4200, followed by 4100. I do not have a scenario in which I am excited about buying anytime soon unless of course the Federal Reserve completely changes its course. At this point, it does not look like it is going to happen, so one has to assume that we eventually find sellers on each rally.

