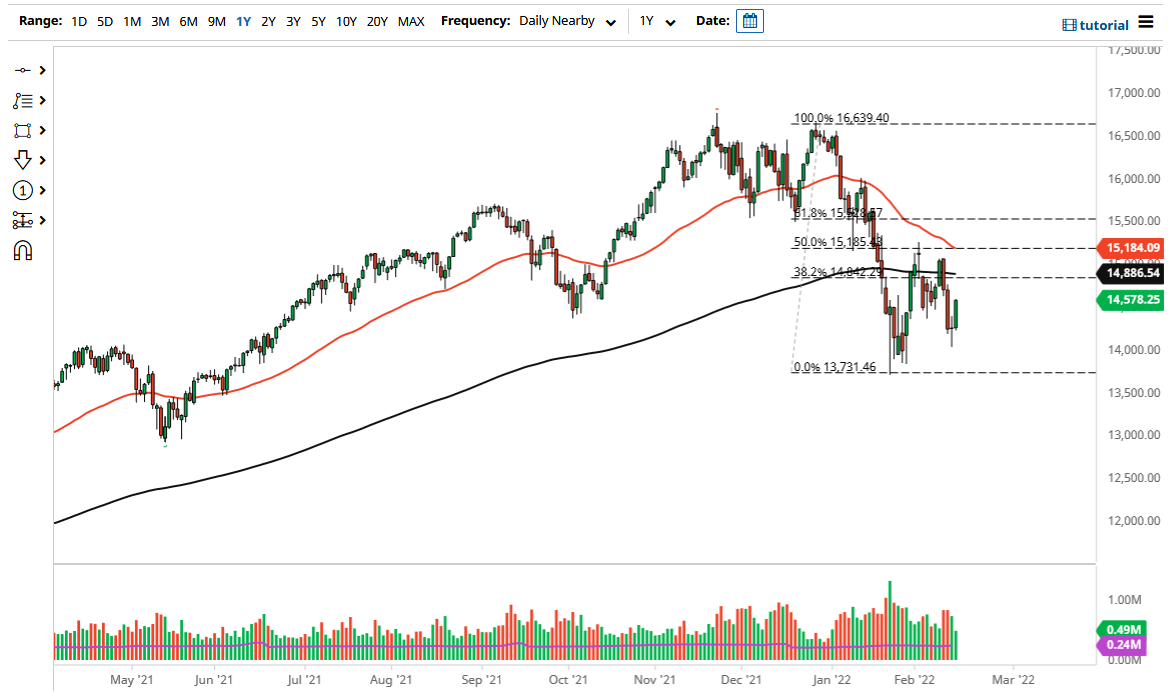
The NASDAQ 100 rallied significantly on Tuesday, breaking above the top of the hammer that had formed during the previous day. That being said, we obviously have a lot of volatility out there, and it is likely that we will continue to see a lot of overall back and forth action as there are a whole plethora of reasons to worry about what happens next with the NASDAQ 100. The Russians pulling some of their troops back from the border of Ukraine seems to be good for risk appetite in general, including this index.
Looking at this chart, you can see that the 200 day EMA sits at the 14,886 handle, just below the previous resistance. Any signs of exhaustion near that area will simply have traders shorting this market as we continue to go back and forth, so it is likely that we will see more consolidation than anything else. We have just made a “higher low” in the market, but it is difficult to imagine a scenario where we would simply take off to the upside. The market could be trying to form a bearish flag, or it could be trying to form a bearish pennant, take your pick. As things stand right now, it certainly makes sense that we would try to do something along those lines.
It is also worth noting that the 50 day EMA is starting to curl lower, and perhaps break down below the 200 day EMA. The market looks at the 14,000 level underneath as a large, round, psychologically significant figure. If we can break down below there, we could see a bit of a “trapdoor” open up and send this market much lower.
When you look at the chart, it looks like a lot of buying came back in but the volume was less than impressive, and it does make sense that we would see a significant amount of pressure for any type of rally. I am looking for signs of exhaustion to start buying puts, because it is very rare that I short US indices as they are so readily manipulated. The markets will continue to be very noisy and unfortunately move based upon the latest rumors or headlines out there to throw things around. This is a particularly sensitive market right now, so I think we have more selling ahead.

