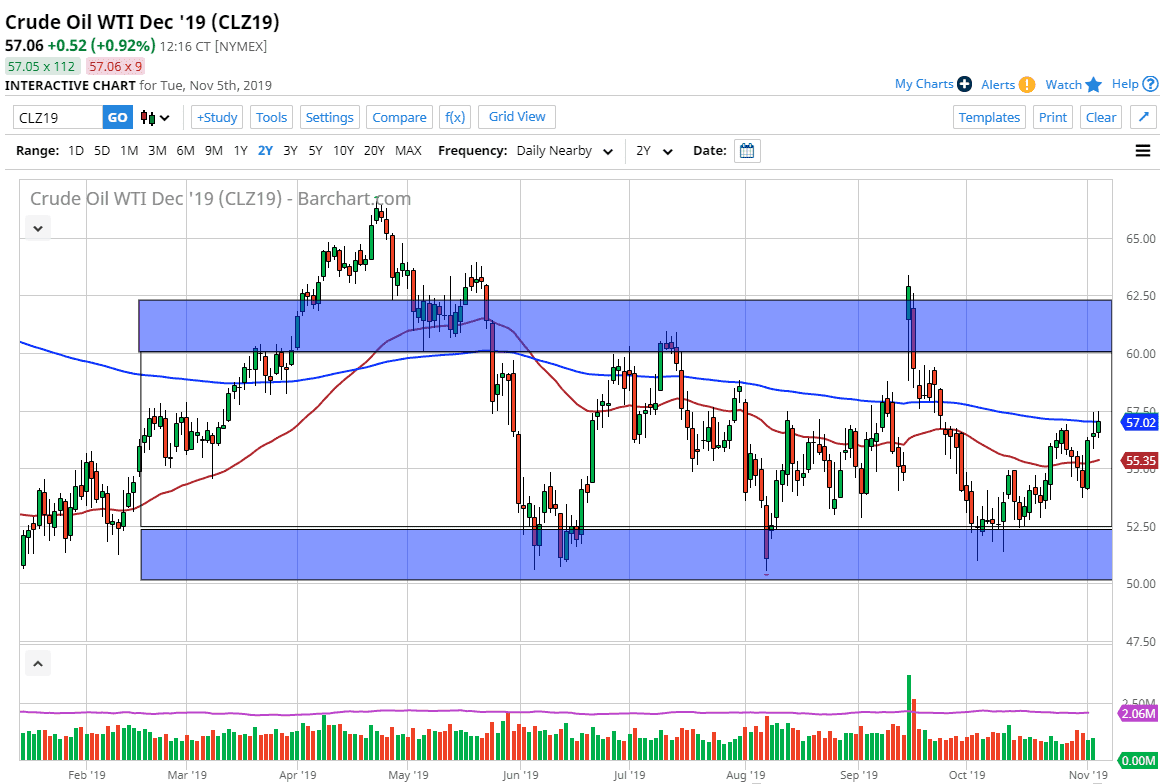
The West Texas Intermediate Crude Oil market will probably have quite a bit of volatility during the trading session as the crude oil inventory figure comes out the United States. During the Tuesday session the market has reached towards the 200 day EMA, an area that obviously would have a lot of influence on the market. Ultimately, this is an area that a lot of longer-term trend traders will follow on both sides. It has been drifting a bit lower, but at this point it certainly looks as if it is trying to flatten out. Beyond that, the red 50 day EMA is starting to turn a little bit higher underneath current trading action.
Looking at the market, we are essentially in the middle of the larger consolidation area, and basically at “fair value.” Ultimately, if the market does pull back in a bit of a knee-jerk reaction to the inventory figure, it could very well find itself offering a nice buying opportunity as the US ISM Non-Manufacturing number has shown such strength in the United States. If the inventory figure is somewhat dovish, I would look at the 50 day EMA as a potential buying opportunity in that area.
Ultimately, the market breaks above the $57.50 level, then the market could go looking towards the $59 level after that. All things being equal, the market is likely to continue to be very noisy, but I think we will stay in the larger consolidation area that has been marked on the chart here. At this point, expect a lot of choppiness and noisy trading, but ultimately, it’s likely that we will simply bounce around in this area as OPEC is looking to cut production in December, but at the same time there are concerns about demand going forward. Ultimately, this means that the market will probably move from the occasional daily headline, but there isn’t enough out there to really get the thing moving wildly. Simple range bound trading makes the most sense, but the most recent leg has certainly been to the upside so that’s why I like the idea of buying pullbacks when they occur. If we were to break out of this major rectangle, then obviously everything would change but until that happens, I assume all things stay the way they have been for some time. Keep in mind that announcement comes out during the day and look at the market is potentially offering value underneath.

