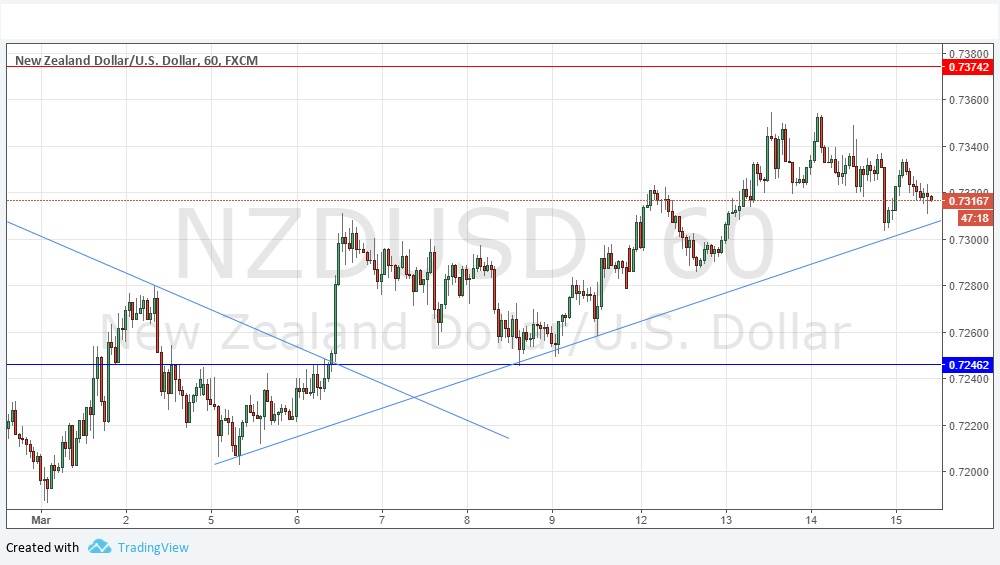
Yesterday’s signals produced a losing long trade following the bullish pin candle which bounced off the support level identified at 0.7323.
Today’s NZD/USD Signals
Risk 0.75%
Trades must be entered from 8am New York time until 5pm Tokyo time, over the next 24-hour period.
Short Trade
Short entry following a bearish price action reversal on the H1 time frame immediately upon the next touch of 0.7374.
Place the stop loss 1 pip above the local swing high.
Adjust the stop loss to break even once the trade is 20 pips in profit.
Remove 50% of the position as profit when the trade is 20 pips in profit and leave the remainder of the position to run.
Long Trade
Long entry following some bullish price action on the H1 time frame immediately upon the next touch of the supportive trend line which is currently sitting at about 0.7306.
Place the stop loss 1 pip below the local swing low.
Adjust the stop loss to break even once the trade is 20 pips in profit.
Remove 50% of the position as profit when the trade is 20 pips in profit and leave the remainder of the position to run.
The best method to identify a classic “price action reversal” is for an hourly candle to close, such as a pin bar, a doji, an outside or even just an engulfing candle with a higher close. You can exploit these levels or zones by watching the price action that occurs at the given levels.
NZD/USD Analysis
I wrote yesterday that it is better to follow the medium-term trend which is bullish. However, it should be noted that the area above 0.7400 has acted as resistance over a period lasting almost three years. My approach did not turn out well, as the level at 0.7324 did initially act as support but broke down when the price was unable to rise any higher – this is a bearish sign. If the price breaks below the trend line shown in the price chart below, that would be another bearish sign, suggesting that a return to the psychological level and support which are confluent at about 0.7250 is on the cards. The action over recent hours seems bearish. I suggest watching very closely how the price reacts at the trend line, if / when it is reached.
There is nothing due today concerning either the NZD or the USD.

