Yesterday’s signals were not triggered, as neither of the key levels were ever reached.
Today’s BTC/USD Signals
Risk 0.75% per trade.
Trades may only be taken until 5pm New York time today.
Long Trades
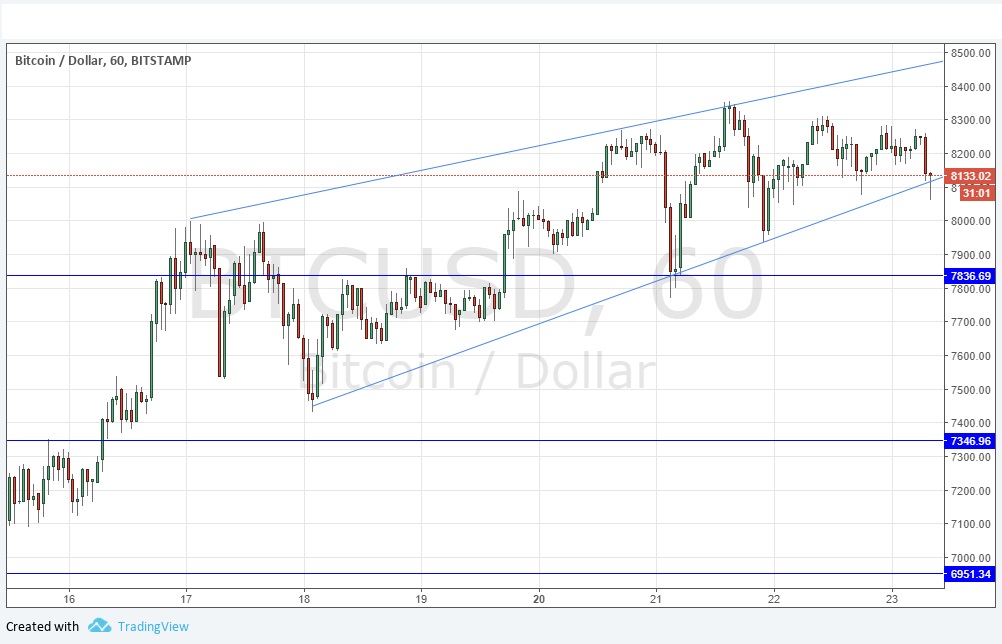
Go long after a bullish price action reversal on the H1 time frame following the next touch of $7836.69 or $7346.96.
Put the stop loss 1 pip below the local swing low.
Adjust the stop loss to break even once the trade is $200 in profit by price.
Remove 50% of the position as profit when the trade is $200 in profit by price and leave the remainder of the position to run.
The best method to identify a classic “price action reversal” is for an hourly candle to close, such as a pin bar, a doji, an outside or even just an engulfing candle with a higher close. You can exploit these levels or zones by watching the price action that occurs at the given levels.
BTC/USD Analysis
There has been no change to the technical picture since yesterday’s analysis. However, things have become quieter, with the bullish wedge still holding, but looking increasing likely to break down. Bulls should not be too concerned if that happens, though, as there is a support level underpinning the structure at $7836.69. If the price makes a sustained break below that level, then it would signify that a deeper bearish pull back was taking place, so that would then be a place where short-term bulls should probably cut their losses and retreat to fight another battle later. Even if this happens, I will still maintain a bullish bias over the coming days, as the price is clearly in a very strong long-term bullish trend, making new all-time highs, with no end in sight.
There is nothing important due today concerning the USD. It is a public holiday in the USA.
