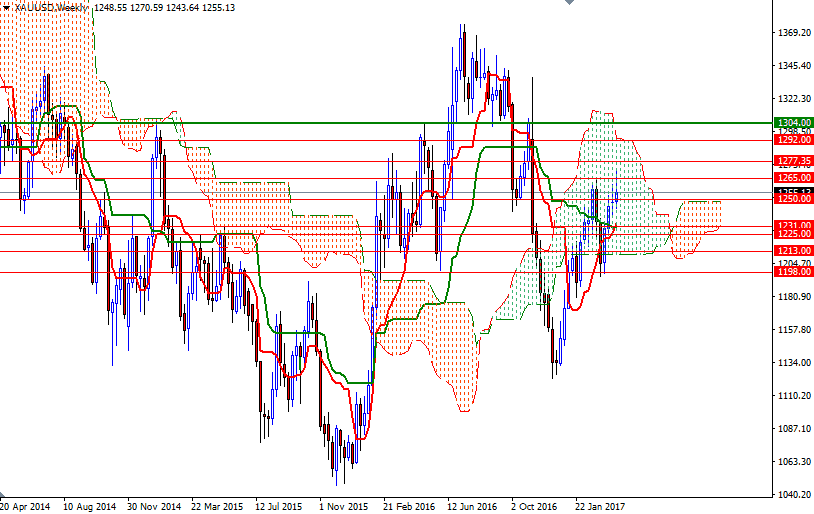
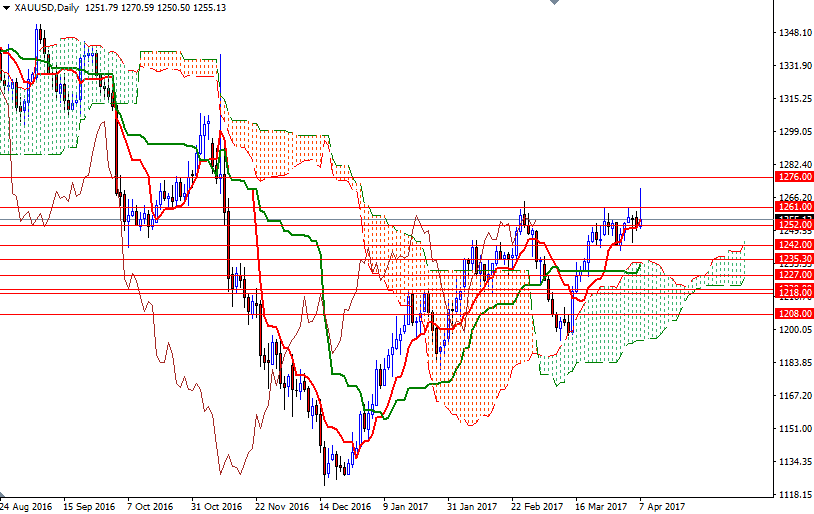
Gold prices settled at $1255.13 an ounce on Friday, gaining 0.55% on the week, as geopolitical concerns increased desire for safe haven diversification. The XAU/USD pair hit the highest level since November 10 after the United States fired missiles at a Syrian airbase. Geopolitical risks usually drive gold prices much higher but current market conditions (the American dollar’s strength and resilient equities) limit interest in gold.
While some believe that last week’s bleak non-farm payrolls report, which showed a net gain of 98000 in March, will give the Fed less confidence that the economy is strong enough to endure higher interest rates, I don’t think that a single report will really alter their plans. The latest data from the Commodity Futures Trading Commission (CFTC) revealed that speculative traders on the Chicago Mercantile Exchange increased their net-long positions in gold to 155436 contracts, from 137820 a week earlier. Speaking strictly based on the charts, the medium-term trend will remain bullish as long as the market trades above the daily Ichimoku clouds. Positively aligned Tenkan-Sen (nine-period moving average, red line) and Kijun-Sen (twenty six-period moving average, green line) lines on the weekly, daily and 4-hour charts also support this theory.
However, the tall upper shadow of Friday’s candle implies that the gold bulls may be getting exhausted after recent strong selling pressure encountered beyond the key resistance at 1261. If the Ichimoku cloud on the H4 chart fails to hold the market, then prices will probably retreat towards the 1242/39 area. The bears will have to shatter this support so that they can make an assault on 1235.30 (the top of the daily cloud). A break down below 1235.30 could trigger further weakness and lead to a test of the 1231 level. To the upside, the 1265/1 zone stands out as an obvious key resistance. A daily close above this barrier would certainly help gold’s case and signal that the bulls are ready to tackle the resistance in the 1277.35-1276 zone. A sustained break above 1277.35 could prolong the bullish momentum and clear the path towards 1292.


