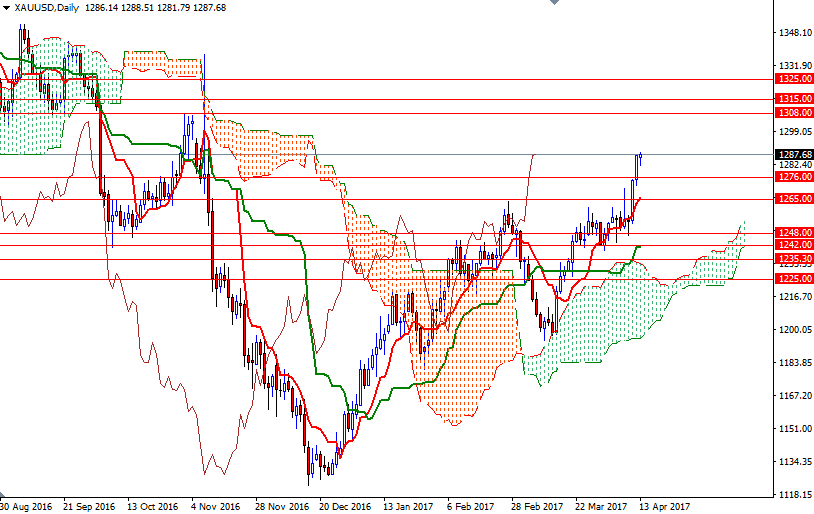
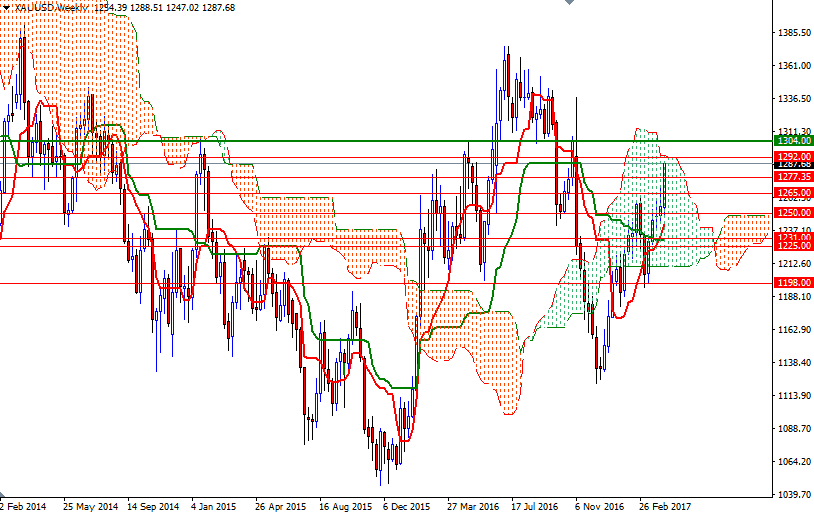
Gold ended the week up $33.29 at $1287.68 as a weaker dollar and sagging risk appetite lured buyers back into the market. Worries over North Korea’s nuclear missile program, the U.S.’s relations with Russia and upcoming French elections prompted investors to seek shelter in safe-haven assets. Precious metals usually benefits from geopolitical risks because uncertainty pushes down stocks on major world markets and increases need for disaster insurance.
The latest data from the Commodity Futures Trading Commission (CFTC) showed that speculative traders on the Chicago Mercantile Exchange increased their net-long positions in gold to 172666 contracts, from 155436 a week earlier. If the U.S. stock markets embark on a more significant corrective move, we may see some fresh buying. But, whether or not this will be enough for the bulls overtake the bears waiting in the 1308/4 region is yet to be seen.
Technically speaking, the daily and the 4-hour charts are bullish while the XAU/USD pair is trading above the Ichimoku clouds. In addition to that, the Tenkan-Sen (nine-period moving average, red line) and the Kijun-Sen (twenty six-period moving average, green line) lines are positively aligned and the Chikou-span (closing price plotted 26 periods behind, brown line) is above prices on both charts. However, I advise a bit of caution at this point because we ultimately reached (almost) to the top of the weekly cloud and the 1308/4 area has played important role (as both support and resistance) in the past.

To the upside, the initial resistance stands in the 1295/2 zone. The bulls will have to convincingly push the market above 1295 so that they tackle the aforementioned solid technical resistance in 1308/4. Closing above 1308 would make me think that XAU/USD could test 1315 and 1325. On the other hand, if higher prices attracts some profit taking and XAU/USD starts retreating, keep an eye on the 1277.35-1276 area. Once below 1276, look for further downside with 1272 and 1269 as possible targets. A break down below 1269 would open up the risk of a move towards 1265/1. The bears will need to capture this strategic support so that they can make an assault on 1255.

