Every day, four days per week, I publish daily signals / forecasts for the seven most important Forex pairs: the USD paired with the EUR, GBP, CHF, JPY, AUD, and NZD.
As I am eager to help developing traders, and cannot update the signals once I have published them, I use the safest method that I can to develop the forecast – I identify and highlight zones of support and resistance where the price has a good chance of turning quickly. A reader who takes note of the zones and watches to see if the price turns if and when it gets there, has a good chance to enter a low risk, high reward, profitable trade.
It is up to the reader to watch what the price does when it gets to these zones. In my opinion, the best method is usually to watch the hourly chart and what for a classic “reversal” candle to close, such as a pin bar, a doji, an outside or even just an engulfing candle with a higher close. You can exploit these levels or zones by watching the price action that occurs at the given levels.
I also suggest moving any trade’s stop loss to break even when it is around 20 or 25 pips in profit (20 pips in the case of the AUD / USD pair), not because this is the most profitable way to trade, but because it is safe in protecting capital as much as possible. However this necessarily limits some trades which eventually turn out to be great runners.
Regular readers will know from their own experience that the support and resistance levels I give are accurate more often than not, and can be exploited profitably by traders. I’m not going to go over all the thousand plus forecasts I made during 2016, but below I will look at how these signals performed over the past 3 months with a single currency pair. I chose the EUR/USD for the simple reason that it is the most popular pair with traders worldwide.
EUR/USD Signals Review 4th Quarter 2016
During the final three months of the year of 2016 (excluding the last 3 weeks of the year), my published daily signals / forecasts for EUR/USD would have given 10 trade entries to anyone following them. It is true that on an average day, my forecasts do not usually give a trade, because it is better to be safe than sorry. It is better to trade one pair 5 times per month and come out ahead than to trade it every day and lose overall. Overtrading is a mistake made by too many traders.
Of these 10 trades, if they had been taken in line with the methodology of waiting for suitable hourly price action off the identified levels as reversals, 5 were sizable wins, 2 were small wins, and there were 3 losing trades. This was a very good record – unquestionably profitable - and probably slightly better than the performance for most of the other currency pairs, although I am certain that overall all the pairs together also had a profitable record.
Trade Highlights
One of the easiest ways to become a more profitable trader is to take only partial profits on winning trades that are in line with the wider trend – if there is one – and leave some of the position to run. Let’s look at a couple of the best EUR/USD trades from the last quarter, and see if there is anything we can learn from them.
This day I suggested looking for a short off a bearish bounce from the anticipated resistance at 1.0865. You can see that the price spiked up to that level before reversing very strongly and quickly, forming a very large outside pin candle. A lesson that can be drawn here is that if an entry candle is very large, as in this case, you will be more likely to get better results if you use a volatility-based stop loss as opposed to placing the stop all the way behind the other side of the entry candlestick. Here, using the candle as the stop would result in a maximum reward to risk ratio to date of less than 2 to 1, whereas using a stop of say 50 pips would have given a hugely better result.
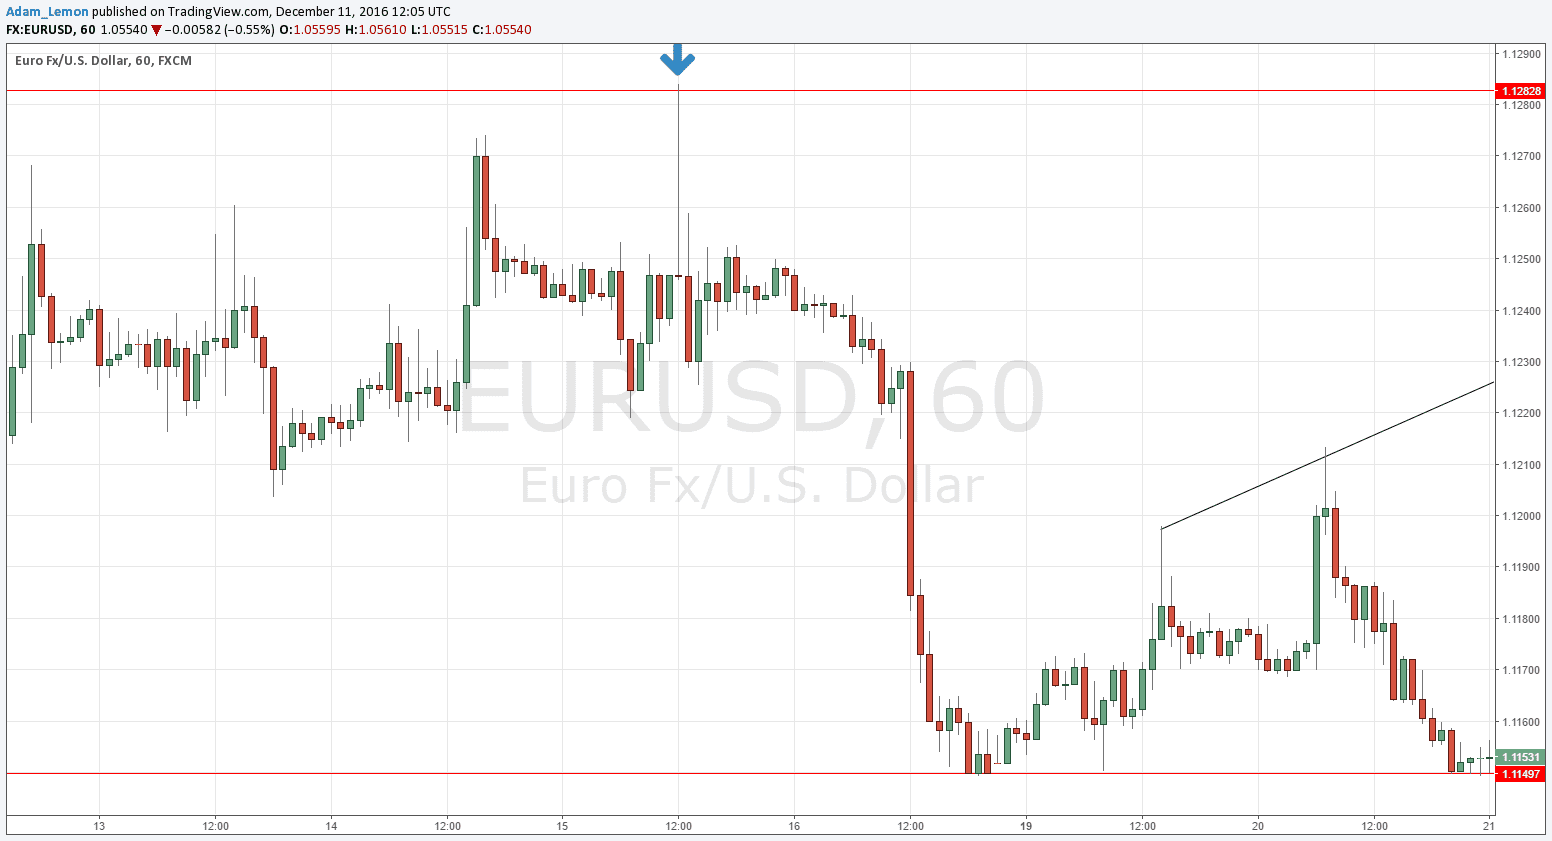
This day I suggested looking for a short off a bearish bounce from the anticipated resistance at 1.1283. The chart below shows that it took a while for a strong move down to happen after the candlestick low was broken, but the trade could still be open today and more than 700 pips in profit! This just shows how profitable it can be if you show some patience and let at least some profit run for weeks or even months. Another lesson which could be drawn is how powerful pin candles can be when they really “stick out” from the body of the price action, as in this example.
How I Draw Horizontal Support & Resistance Levels
It takes some practice but it is not rocket science. Just pull up a long-term candlestick chart for a currency pair and look at the higher time frames such as H4 and D1. Now try to identify the horizontal levels that have held as both support and resistance, where the moves crossing the line have been quite strong and fast. This is how I identify most of the levels that I use in these forecasts and you can try it too.
In the meantime I encourage you to follow my signals as they are quite accurate and can help you find profits. Likewise, I encourage you to leave comments or questions in the comment section below or to contact me via twitter at @DailyForex so that I can help clarify any issues.


