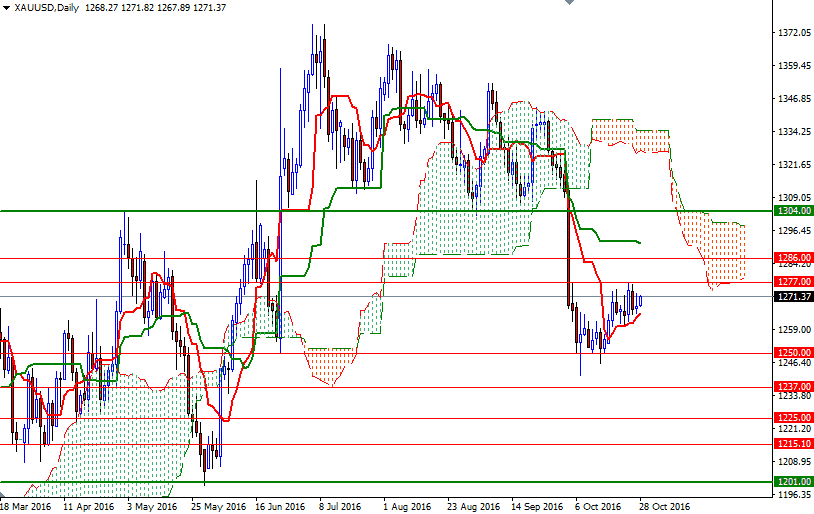
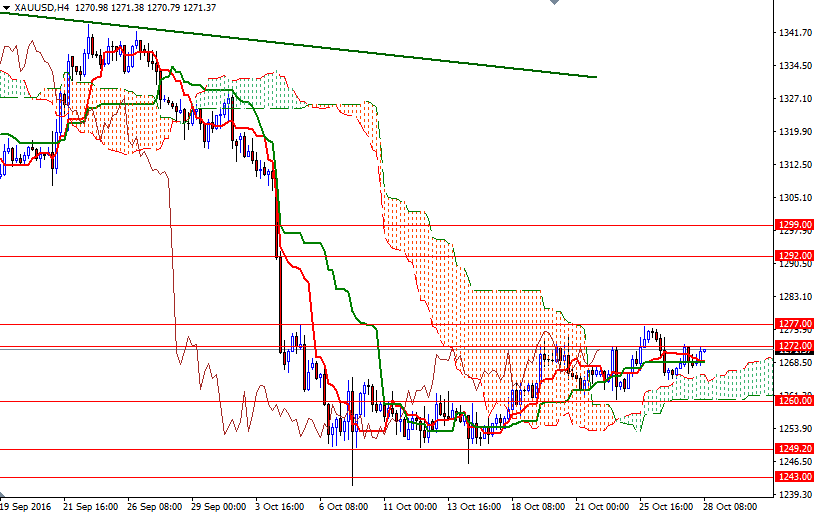
Gold prices edged slightly higher on Thursday, helped by weaker-than-anticipated U.S. durable goods orders data, but remained within the trading range of the past six days. Since we have been moving in a relatively tight range, the overall technical picture has not changed. Speaking strictly based on the charts, the short-term and mid-term charts point opposite directions. Prices are moving above the weekly and 4-hourly clouds but we are still below the cloud on the daily chart.
Today sees the release of U.S. third-quarter GDP data so market participants may be reluctant to make aggressive bets. From an intra-day perspective, I will keep an eye on the 1272/0 area on the top and 1266/4 area (where the top of the Ichimoku cloud on the 4-hour time frame sits) on the bottom. The 4-hourly cloud continues to be supportive but the XAU/USD pair has to push its way through the 1272/0 resistance zone in order to gain more momentum and tackle the 1280/77 barrier. Once above that, I think the market will be targeting the 1286 level.
On the other hand, if XAU/USD drops through 1266/4, then we may test the support at the 1260 level, which happens to be the bottom of the cloud on the H4 chart. Breaking below the 1260 level could encourage sellers and pave the way for a retest of 1250-1249.20. Closing below 1249.20 implies that the 1243/0 region will be the next port of call.


