S&P 500
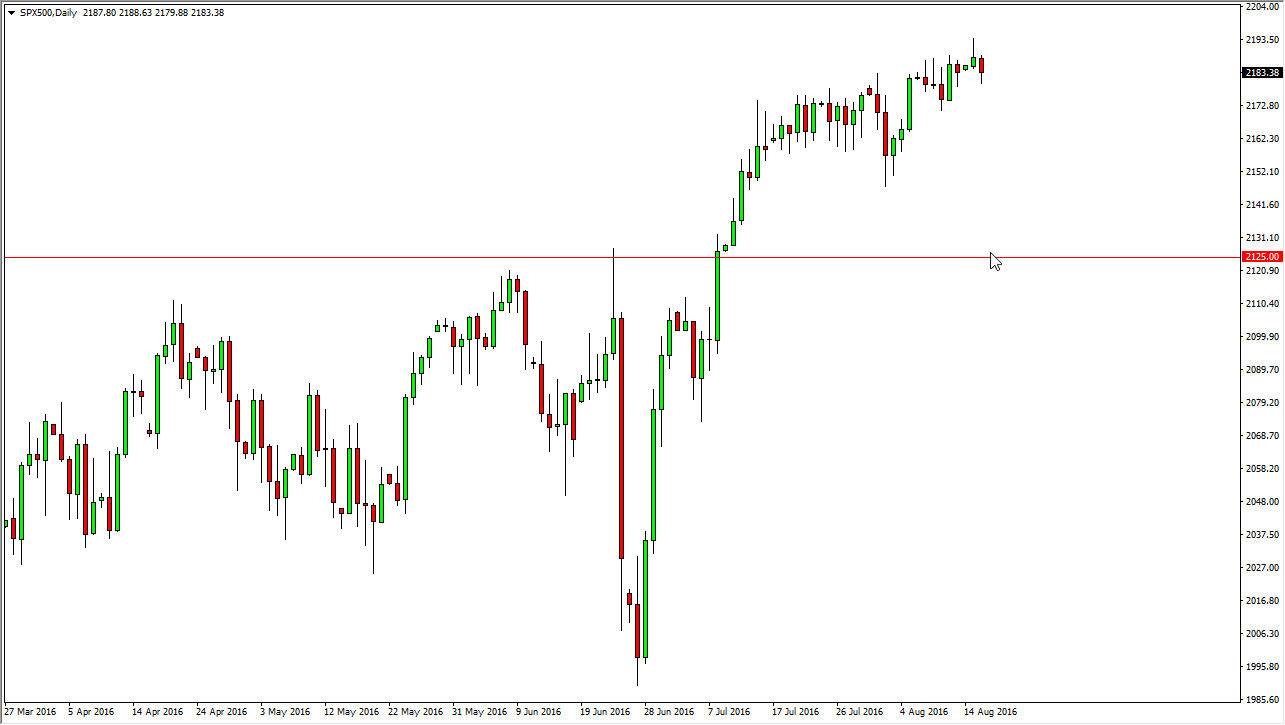
The S&P 500 did pullback a little bit during the day on Tuesday after forming a shooting star on Monday. However, this is more or less going to be in reaction to the psychologically significant 2200 level that was reached during Monday’s trading, so therefore I think that this pullback is probably just another attempt to build up momentum. Most certainly, there’s nothing on this chart that tells me that we should be selling this market, and I am a buyer over the longer term. Notice that over the last several weeks it’s been fairly choppy and I think that will continue to be the case. It’s going to be a slow “grind” higher, and therefore it’s going to be very difficult to hang onto position unless you simply “hold your nose” and play along.
NASDAQ 100
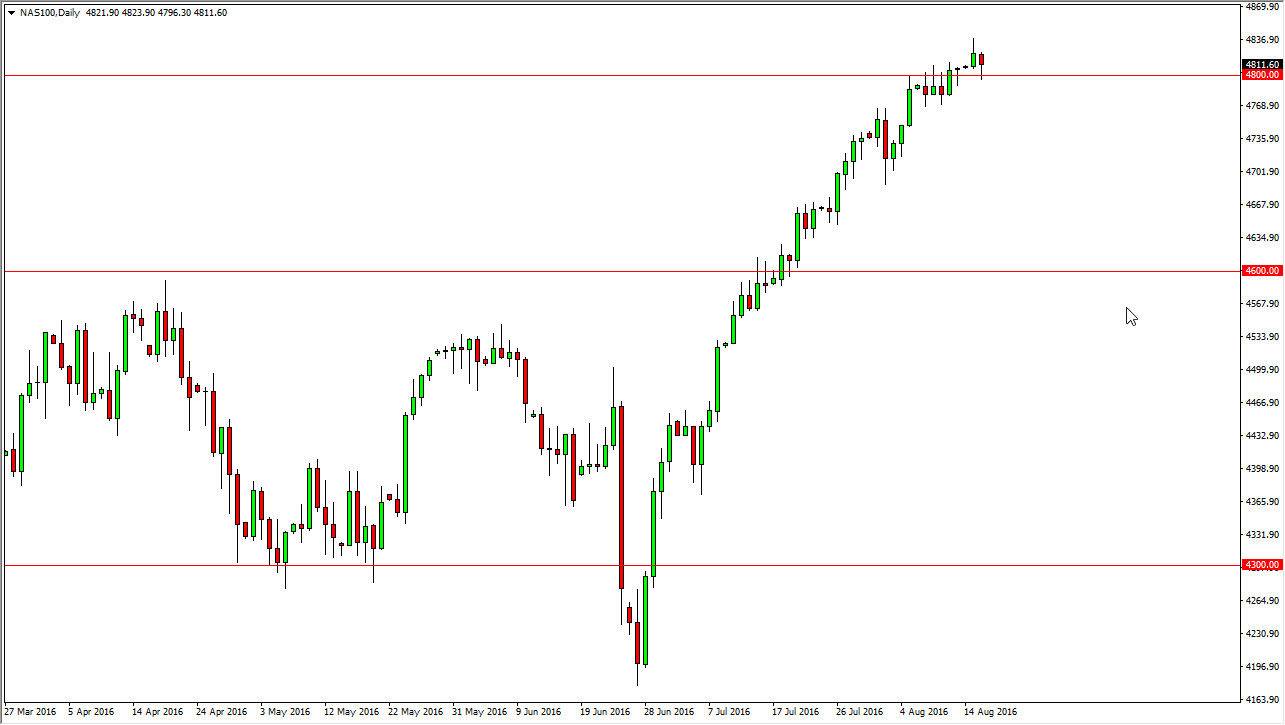
The NASDAQ 100 initially fell during the course of the day on Tuesday, testing the 4800 level. However, by the end of the session we started to see buyers come back into this market and pick the NASDAQ 100 back out. By doing so, we ended up forming a fairly supportive candle I think it just shows that we are indeed going to try to reach the 5000 level over the longer term. That doesn’t mean going to do it today, and that certainly doesn’t mean that we can’t continue to pull back a little bit. However, when I am seeing on this chart is massive support at various levels. I think the overextended rally has scared quite a few traders out there, but quite frankly there are no other ways to pick up money in the markets right now other than stocks or risk assets in general. After all, bonds are offering nothing and then essentially forces people into the stock market in order to make gains. At this point, it looks very likely that we go higher.


