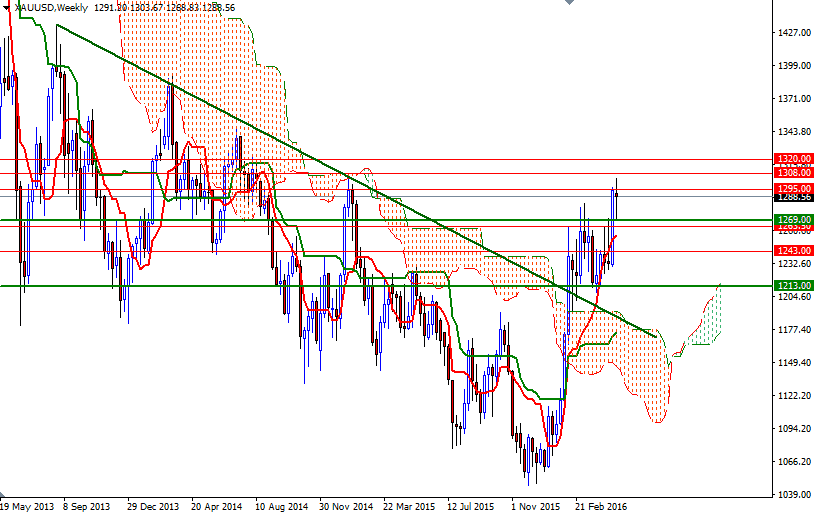
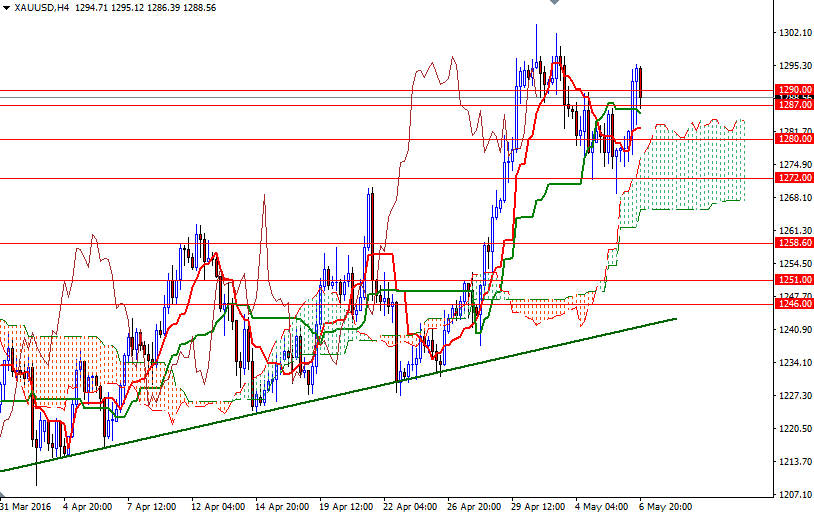
Gold ended the week down $2.64 at $1288.56 an ounce as hawkish comments from Fed officials weighed on the market. The XAU/USD pair initially tried to rise but failing to hold above the $1295 level prompted investors to book profits ahead of the Labor Department's non-farm payrolls report. Consequently, prices fell but then bounced up quite nicely from the anticipated support level at $1269 and returned to the $1295 level again after the U.S. employment data showed weaker-than-expected growth in April.
Going forwards, the market will focus on prospect of a rate hike by the Fed in June. Although the latest batch of soft U.S. data supported views the Federal Reserve will take a cautious stance in normalizing policy, there is one more set of jobs data before the next FOMC meeting. The longer the Fed holds fire in raising rates, the better for gold. On the other hand, the fact that Fed officials are planning to lift rates two times this year may cap gold prices. Speaking strictly based on the charts, the medium-term trend will remain bullish as long as the market trades above the weekly and daily Ichimoku clouds. Positively aligned Tenkan-Sen (nine-period moving average, red line) and Kijun-Sen (twenty six-period moving average, green line) lines also underpins this notion.
However, in order to confirm that prices have more room to run, the market will have to anchor above 1295 and clear the 2015 high of 1308. In that case, I think the XAU/USD pair will be testing 1312 and 1320 afterwards. Closing beyond 1320 on a daily basis paves the way towards 1332/0. To the downside, the supports such as 1280 and 1272/69 stand out at first glance but since this area is occupied by the 4-hourly cloud, it makes more sense to pay a bit more attention to this region rather than specific levels. If the market drops through and closes back below 1263, then 1258.60 and 1251/46 the bears' next possible targets.


