Gold prices slipped for a third straight session and settled at $1243.60 per ounce, losing $11.77, as strength in equities markets and a rebound in the dollar sapped demand for the metal. Stock markets in the U.S. closed higher yesterday although weaker than anticipated existing home sales data limited gains. Sales of existing homes fell 7.1% in February according to the National Association of Realtors.
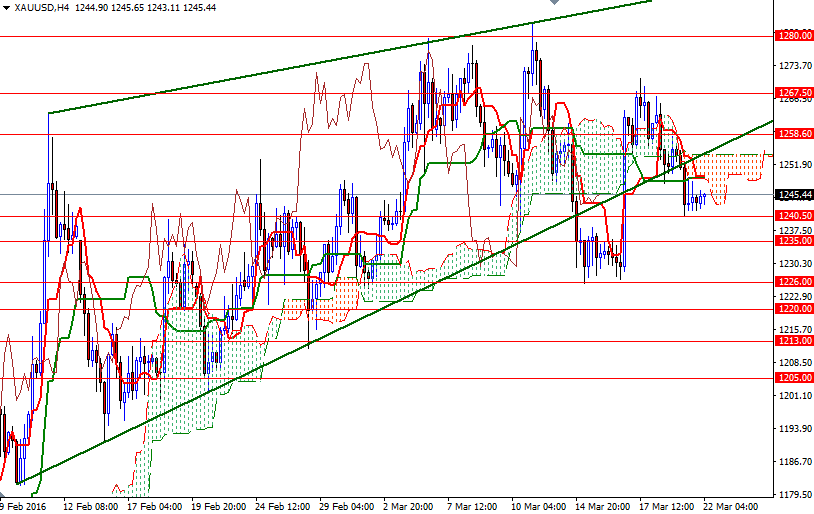
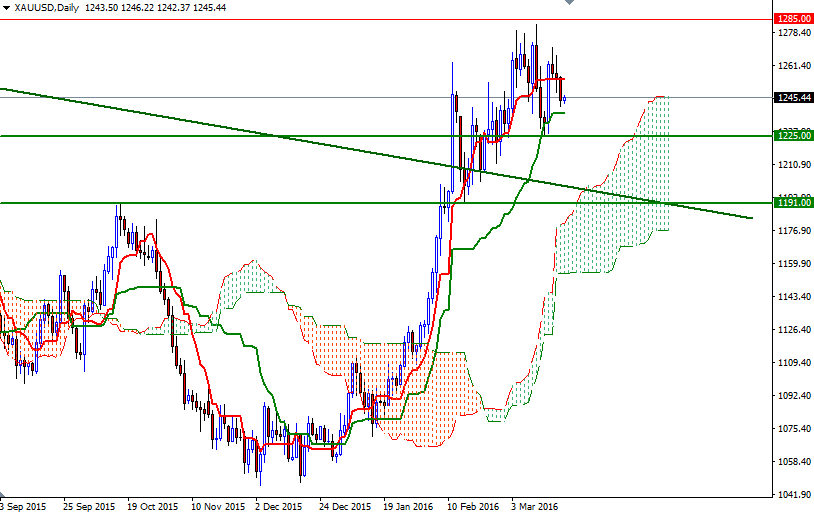
The XAU/USD is currently trading at $1245.44 an ounce, as the market inched higher after finding some support above the 1240.50 level. From a technical point of view, there are two things that I pay attention at the moment. Firstly, prices are sailing beyond the weekly and daily clouds and we have bullish Tenkan-sen (nine-period moving average, red line) - Kijun-sen (twenty six-day moving average, green line) crosses, indicating that we have more pressure from the bulls than bears in the medium-term. On the other side of the coin, there is a wedge formation which prices broke out on the downside; plus now the market is below the 4-hourly cloud.
If the market holds above the 1240.40 region, we may see XAU/USD trying to penetrate the 1249.50-1255.50 resistance where the Ichimoku cloud on the 4-hour chart reside. Climbing back above the cloud and the ascending line would be a bullish sign and open a path to nearby resistance at 1258.60. Closing beyond this barrier would make me think that we are going to pay another visit to the 1276.50 level. If XAU/USD remains below the cloud and drop through 1240.50, then it is likely that the market will test the 1235/3 area. The bears will have to drag XAU/USD below 1233 so that they can find a new chance to march towards 1226.


