S&P 500
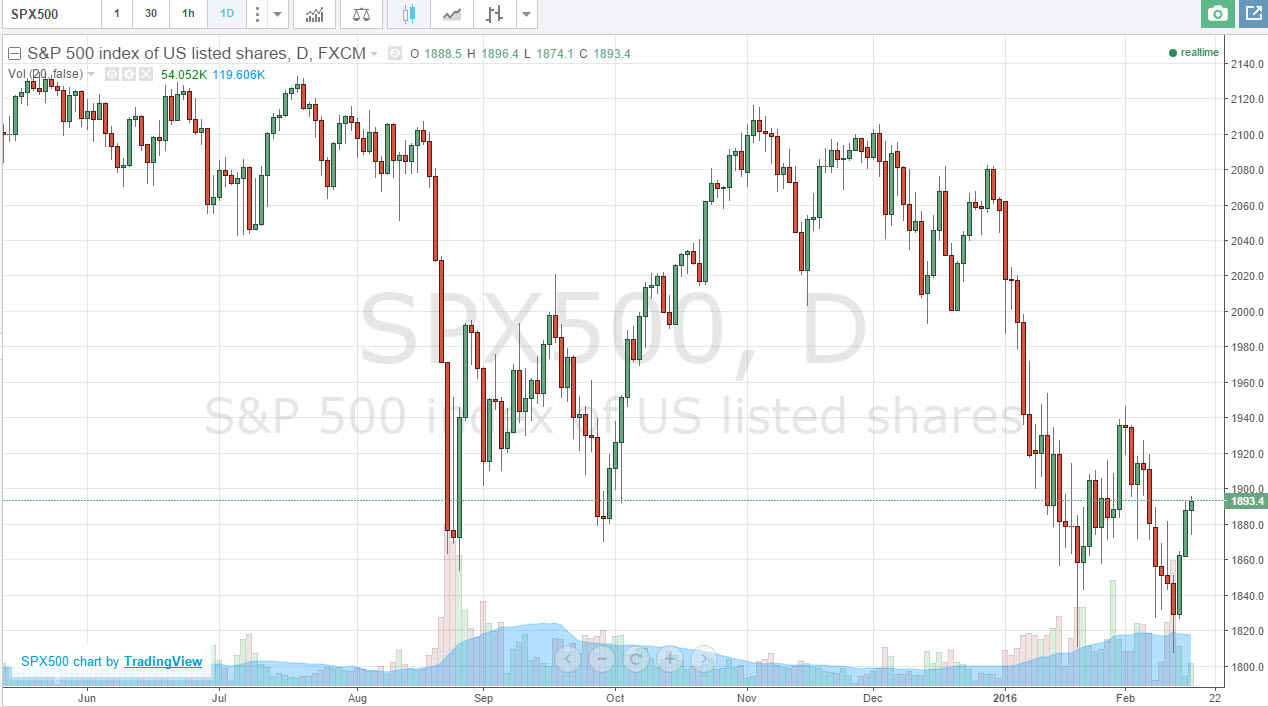
The S&P 500 initially fell during the day on Tuesday, but found quite a bit of support at the 1870 level to turn things around and form a bit of a hammer. The hammer of course is a very bullish sign and as a result it is very likely that we will continue to go higher. I believe that short-term traders will be rewarded by going long, but you cannot hang onto the trade for any real length of time at that point in time.
The 1950 level above should be pretty resistive, so we can break above there eventually, then it becomes a longer-term move. In the meantime, I think that this is simply a return to the top of the consolidation area that we have been in recently. Ultimately, this is a market that should continue to show overall downward pressure, because there so many negative influences out there right now.
NASDAQ 100
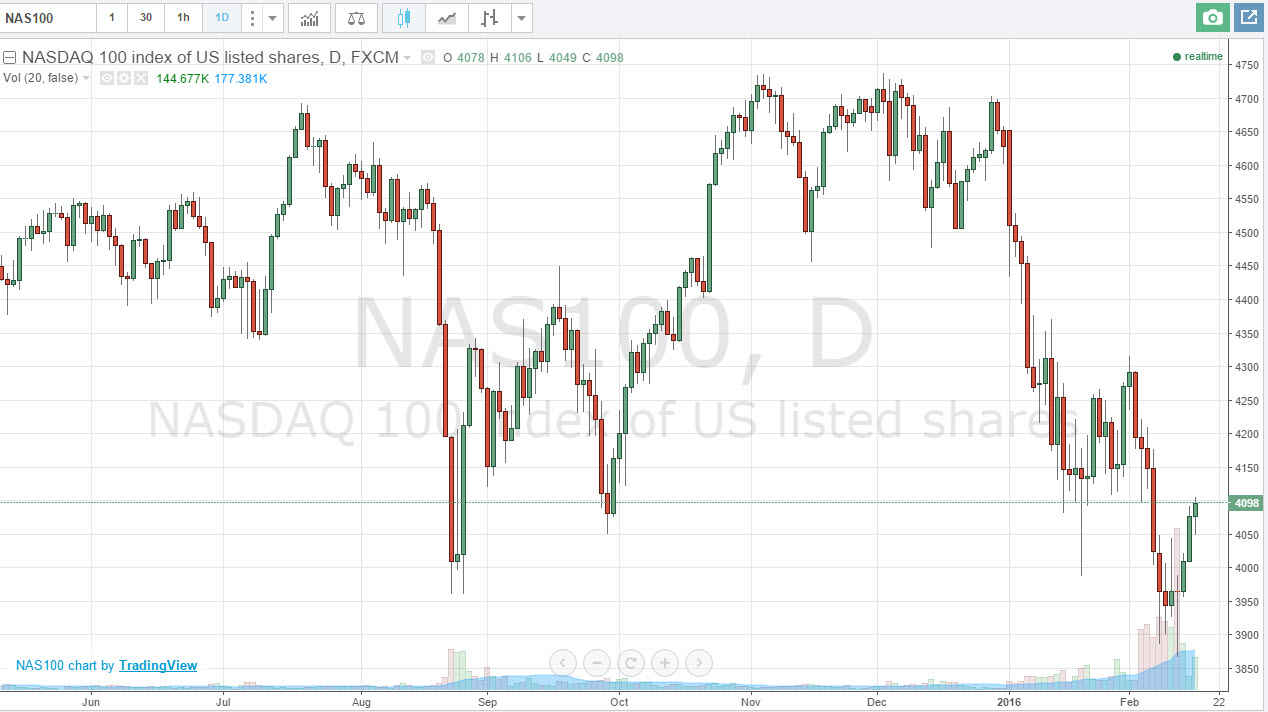
The NASDAQ 100 did the same thing during the day, falling initially but bouncing. We bounced off of the 4050 level, and formed a nice-looking hammer. The hammer is testing the 4100 level, which of course is an area where we had seen quite a bit of support in the past. Ultimately, if we can break above there it’s likely that the market will see quite a bit of selling pressure but we would probably have to make a run towards the 4250 level next.
If we break down below the bottom of the hammer, it’s likely that the market will collapse and fall back to the 3900 level given enough time. Quite friendly, I feel that there are enough headwinds out there right now and potential time bombs that buying this market is going to be the more difficult of the 2 potential trades. Given enough time, we will have to have some clarity, but we don’t have it quite yet.


