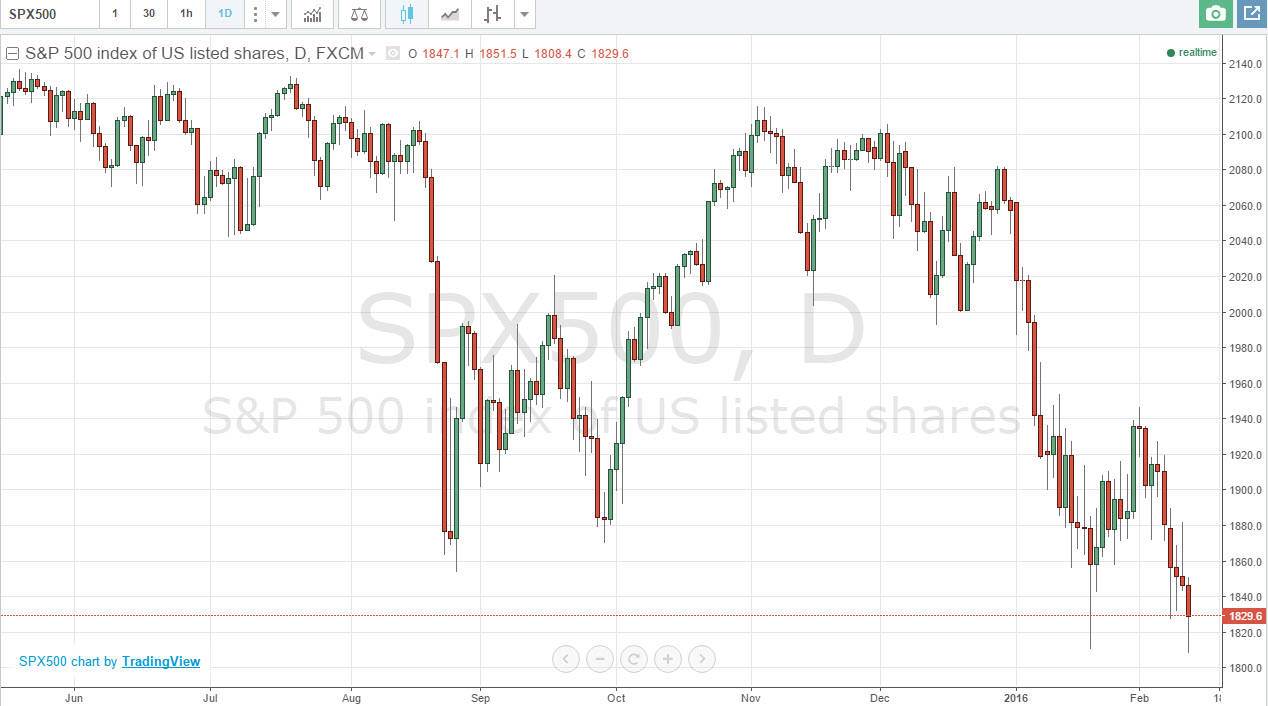
S&P 500
The S&P 500 fell during the day on Thursday, testing the 1800 region. Ultimately, this is a market that looks as if there is a bit of support at 1800, but it’s probably going to eventually break down below there. Although the candle does look a bit like a hammer, the reality is that we continue to see selling pressure again and again. That of course is a very negative sign. If we rally from here, I’m going to simply wait until we get a resistive candle above that we can start to sell. Once we do, I will be much more comfortable shorting this market rather than buying it.
Janet Yellen has suggested that the Federal Reserve will have to wait a while before raising interest rates, the first signs that the Federal Reserve is somewhat concerned about the economy. Because of this, it makes sense that stock markets in America continue to drop a bit.
NASDAQ 100
The NASDAQ 100 fell initially during the day on Thursday, but turned back around to form a bit of a hammer. The hammer is a very bullish sign, and as a result it’s possible that we could get a bit of buying pressure. Normally, I would be a buyer but the resistive shooting star during the previous day keeps me a bit hesitant as far as going long is concerned.
On top of that, the NASDAQ is heavily influenced by the international markets, which of course are falling apart. After all, technological companies out of the United States tend to export quite a bit, and that of course means that the NASDAQ 100 is sensitive to places like Europe and Asia. With that being the case, it’s very unlikely that the NASDAQ 100 will suddenly shoot straight to the upside. It seriously would take quite a bit to get me to start buying this market. I think just like in the S&P 500, the best rate is going to be simply selling short-term rallies as they appear.


