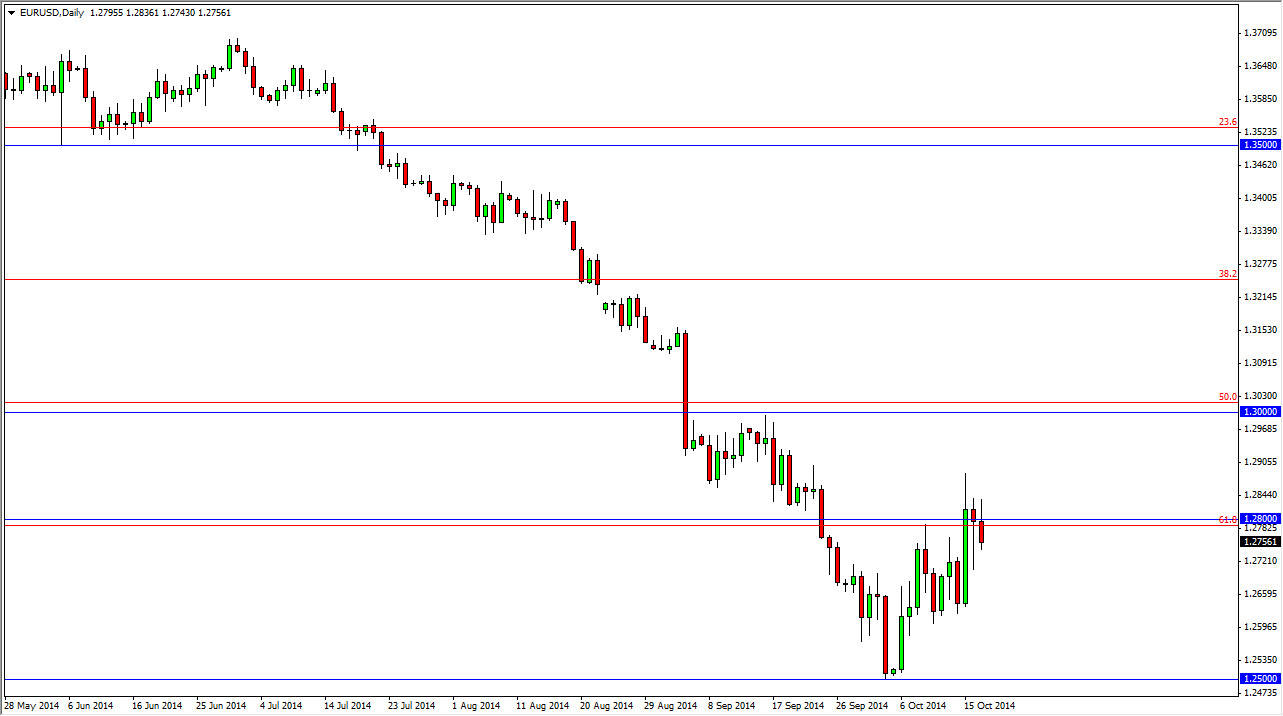
The EUR/USD pair has recently tried to gain strength after falling all the way down to the 1.25 handle. However, the market could not keep any of the gains above the one point to a level, and for me that is very important as I have identified the 1.28 level as the beginning of a significant amount of resistance that extends all the way up to the 1.30 handle. Because of that, I think that it’s only a matter of time before we end up falling again, and we even have a Japanese candlestick formation that could give us a bit of a “heads up” on that selling opportunity.
The Thursday candle was a hammer at the 1.28 handle, and quite frankly could have been a sign that the market wanted to go higher. However, if you break the bottom of that hammer, the hammer then becomes what is known as a “hanging man”, one of the most of bearish signs that you can see as far as candlestick charting is concerned.
The trend matters
What I really like about the potential hanging man is the fact that it goes with the trend as well. The 1.28 level was the 61.8% Fibonacci retracement level from the entire move higher that we are falling out of now. The fact that the area offered resistance after initially collapsing tells me that there is still plenty of selling pressure.
However, you have to look at the 1.25 level as potential trouble on the downside as it is a large, round, psychologically significant number. It doesn’t mean that it can be broken, just that we may have to make several attempts to get below that level. Ultimately, I think we do break below there and head towards the 1.21 level, or perhaps even the 1.20 level. Somewhere in that region I’d be more than willing to take profits and start thinking about a trend reversal yet again. Nonetheless, I have no interest in buying the Euro until we get above the 1.30 level, something that doesn’t look like it’s going to happen anytime soon.

