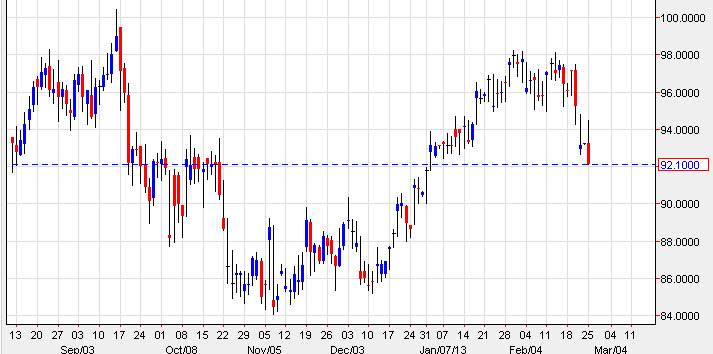
The WTI markets had a wild session on Monday, as the market went higher in the early hours, only to turn around and fall apart by the end of the day. The market had printed a shooting star on Friday, and as a result it already looked fairly soft from that point. However, when you break the top of the shooting star from the previous session, it is normally a massively bullish sign. This was just missed on Monday, and as a result it looks as if the sellers stepped back into the market.
The shape of the candle for the session on Monday is a bigger shooting star, and as a result it looks like the market is going to continue to weaken. The Italian elections and the surprises from that certainly didn’t help, and as a result we saw the markets sell anything even remotely risk related. (This included oil of course.)
The “risk off” trade normally has a lot of commodities being punished as funds have to sell profitable trades, mainly to cover margins. (This says a lot about the kind of money management being practiced by the “pros”.) This often sees higher beta plays being reversed, and this is what happened in this market from what I see. However, the market was already “leaning” in that direction.
$90.00
Looking at this chart, I can see the market falling to the $90.00 level by the time it is all said and done. This level shows a significant amount of support on the chart, and it is also a large round psychologically significant number as well. With that being the case – it makes sense.

I do however, see a lot of noise in the general vicinity now, and the move down to $90 will more than likely be choppy. However, I think we are going down there. This is also because of the sequestration on Friday in America, which is expected to slow down the economy going forward. The demand for oil is thin, and about to get thinner. I still think this market has been driven mainly by Federal Reserve easing than anything else. If that is the case - $90 may not be low enough.
