By: Andrei Tratseuski
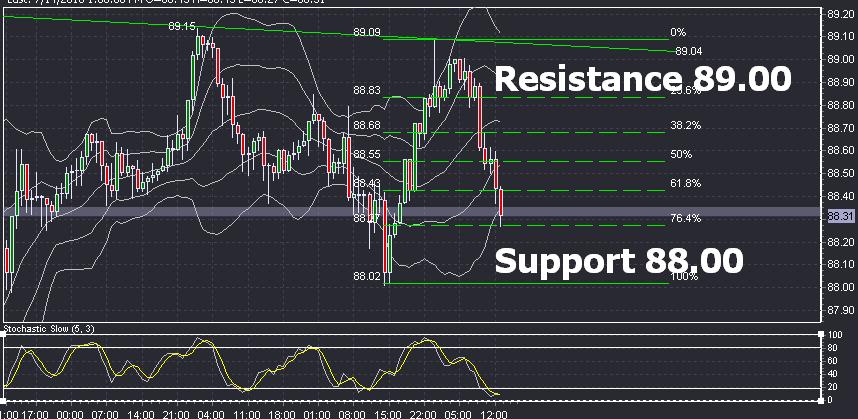
The Japanese Yen has been in range trading for sometime now. For the past four trading days, USD/JPY failed to break the first standard deviation of the Bollinger Bands on daily charts. However, when we take a look at hourly charts we see a perfect range trading scenario for the currency pair. In range trading, it is prudent to buy on the bottom and sell on the top. Current range in USD/JPY is currently between 88.00 and 89.00. Despite it being a tight range, there are plenty of opportunities to capitalize on the movements with low amount of risk.
In order to derive appropriate levels of entry and exits we will turn to Fibonacci retracements, slow stochastics, and simple lines. There is no reason to complicate range trading in order to make a decent amount of pips. Currently the price descendent from a resistance level of 89.00 to 88.30. The following level is a 76.4% retracement of support at 88.00 and resistance at 89.00. Looking at slow stochastics, we find that they are in oversold zone, below 20 scale. Therefore, we look for further confirmation of trend changing to the upside. Here are the guidelines to anticipate: wait for the slow stochastics to exit oversold position. Whenever slow stochastics exit oversold zone a change in trend is more predominate. Thereafter, make sure that there is a solid support level has either been established or has been hit. A good example will be 88.00 which represents a double bottom formation. After the following level has been set and confirmed, look for resistance to exit the position. Current resistance hovers at 89.00 which is 1st standard deviation of the Bollinger bands as well as down sloping resistance line for the pair.

