This article will explain how to use the MACD indicator so you will learn how to:
- Identify momentum reversals.
- Predict turning points.
- Get higher win rates and better trades as a result.
What is the MACD Indicator?
MACD (or Moving Average Convergence Divergence) – pronounced “mac-dee” – tracks price momentum strength. Because of its popularity, it is a standard technical indicator included in every trading platform.
MACD Calculation
You very probably won’t ever need to calculate the MACD indicator manually, but you will get a better understanding of the indicator if you know how its output is derived.
There are three parts to the MACD indicator:
Part1: MACD Line
The MACD line is the difference between two exponential moving averages (EMAs), one known as a fast EMA and the other a slow EMA. The one with the lower look-back period is the fast EMA.
Part 2: Signal Line
The signal line is a moving average of the MACD line, giving the effect of smoothing out the MACD Line. The most common signal line setting is a 9-period moving average (SMA or EMA are both common types of moving average which are used for this).
Part 3: MACD histogram
The MACD histogram (displayed as bars) is the MACD line minus the signal line.
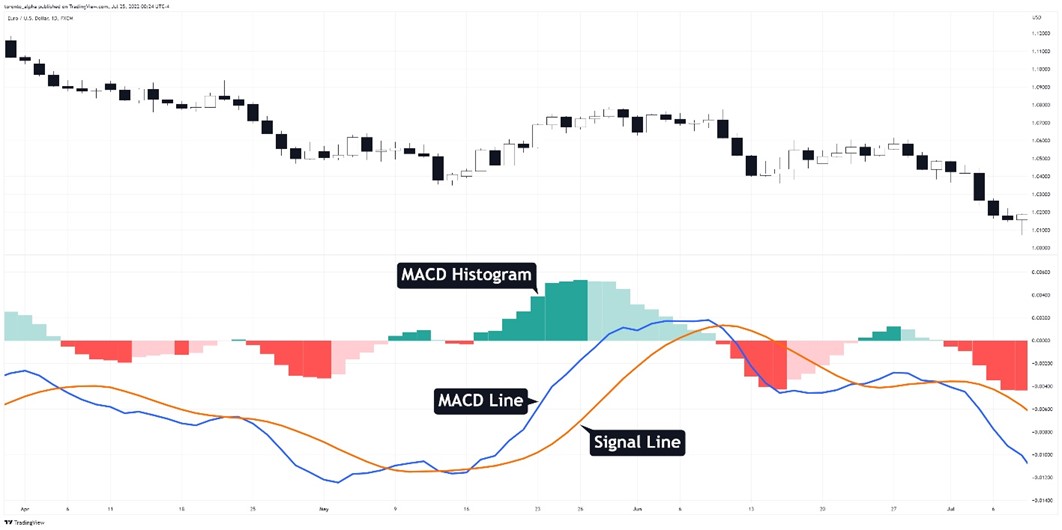
Depending on your MACD strategy, you may only need to display the histogram as the rest of the indicator might not be useful to you. The indicator settings on your platform will let you keep the histogram and remove the other lines if you want.
MACD Settings
The most common MACD indicator settings are 12, 26, and 9, which means:
MACD Line: 12-EMA and 26-EMA.
Signal Line: 9-period moving average (SMA or EMA). Interestingly, MetaTrader 4 and 5 requires that the signal line is set as a simple moving average, while many other platforms let it be either an SMA or EMA.
While these are the most popular settings, you can adjust them to your liking on your trading platform.
How to Read the MACD
The MACD histogram bars become longer as the gap widens between the MACD line and the signal line:
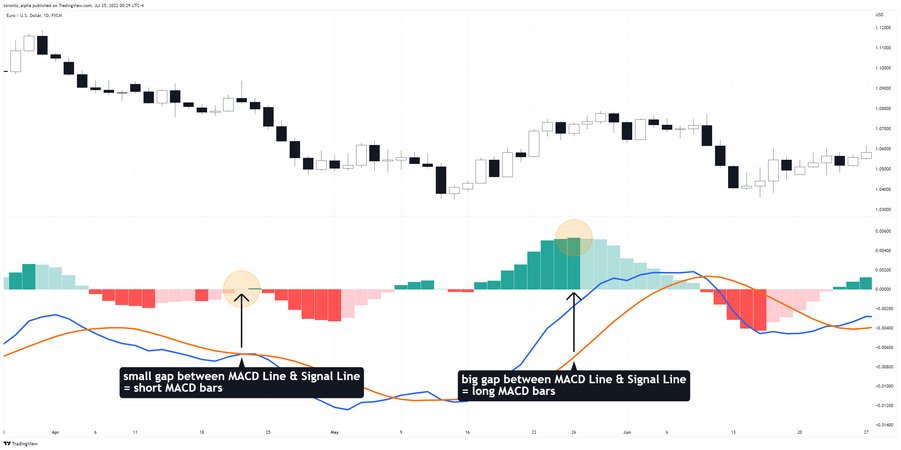
Longer histogram bars = greater price momentum.
Shorter histogram bars = weaker momentum.
This concept is key to how the MACD indicator tracks and displays momentum. I will build on this as I look at two common MACD strategies: momentum reversal and trend entry, which can help you get started using MACD in Forex and other markets.
MACD Strategy #1: Momentum Reversal
There are three steps to trading momentum reversals using the MACD indicator.
Step 1: Price moves into support or resistance
First, you want the price to move into a market structure, especially a previous support or resistance level. Never blindly use indicators—MACD works best when you combine it with price action context.
Step 2: MACD histogram matches the price direction
- If the price moves up to resistance, the MACD histogram should be above the zero line, i.e., showing bullish momentum.
- If the price moves down into a support area, the MACD histogram should be below the zero line, i.e., showing bearish momentum.
Ideally, you want to see large MACD bars with the price moving swiftly to previous support or resistance. That may seem counterintuitive as you are about to trade against that move. However, swift moves can snap back and reverse quickly, putting you in profit faster, so the strategy seeks such moves as reversal entry points.
Step 3: Price rejection
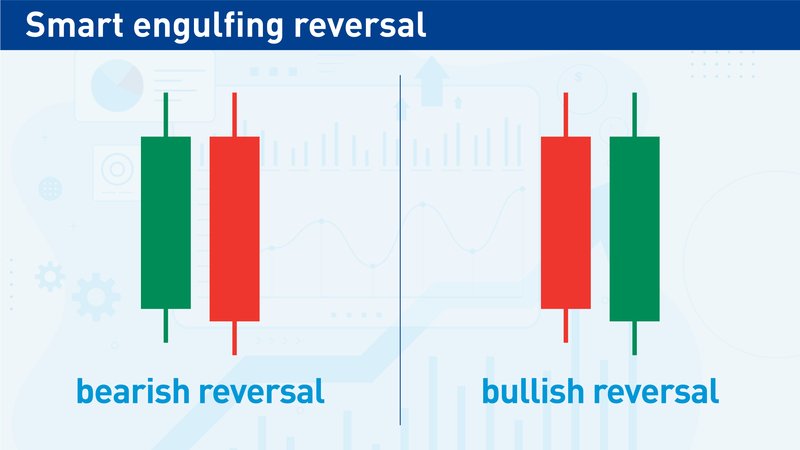
Before entering a trade, the price must reject the support or resistance level. This could be a simple bounce or a reversal pattern. I particularly like two reversal patterns: one I call the “smart engulfing reversal,” and the other is the pin bar.
Smart engulfing reversal:
The pattern is a candle with a long body and short wicks followed by a candle in the opposite direction, again with a long body and short wicks.
- Each candle's real body should be at least two-thirds of the entire candle’s full length.
- The second candle’s body must cover most of the price range of the first candle’s body.
Pin Bar:
A pin bar or candlestick has a real body confined to the bottom or top third of the candle length. The direction of the long wick determines whether the candle is bearish or bullish (regardless of whether the candlestick body is bullish or bearish).
.jpg)
Trade examples:
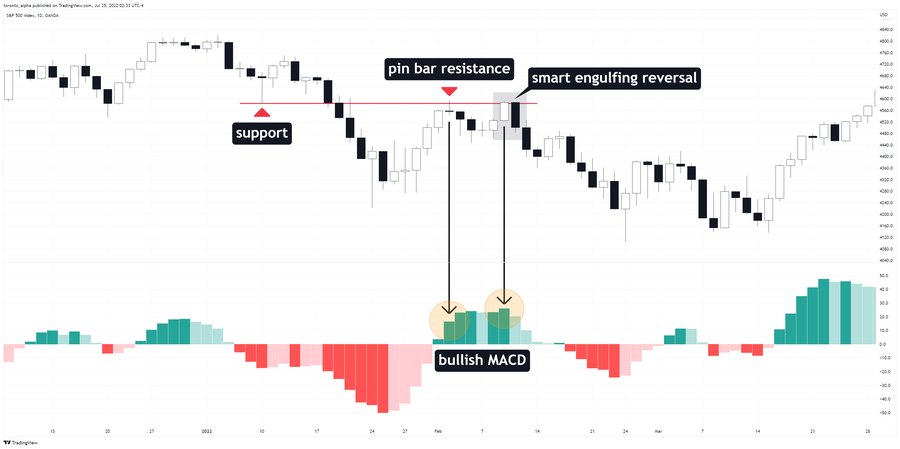
- The price makes a pin bar resistance with bullish MACD momentum at a previous support level. It is common for a previous resistance level to turn into support, and vice versa—this is known as “role reversal”. In this case, the role reversal gives you a short trade entry opportunity.
- A “smart engulfing reversal” pattern then appears at the same level, and again there is bullish MACD momentum. Now you have a second short trade entry opportunity.
Notice that the second short entry has stronger bullish MACD bars, yet the price falls further than the first entry. It demonstrates you can trade against strong price momentum if you have the correct price action context to do so.
Here is another example set-up in the EUR/USD currency pair:
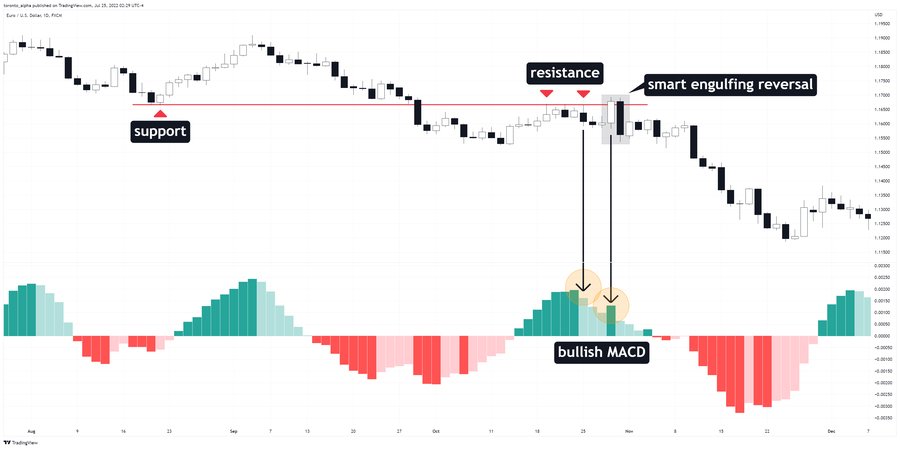
Interestingly, in this example, when the price forms resistance after breaking support, the price action is subtle, but the MACD bars appear very bullish. This is a clue to help you enter short. In case you missed it, a bearish smart engulfing pattern appeared at the level with bullish MACD bars to give you another short entry opportunity.
MACD Strategy #2: Trend Entry
Step 1: Identify the trend
Make sure you are looking at a trend correctly:
- An uptrend has a series of higher lows.
- A downtrend has a series of lower highs.
Step 2: Identify a pull back
The best place to enter a trend is when the price pulls back against it.
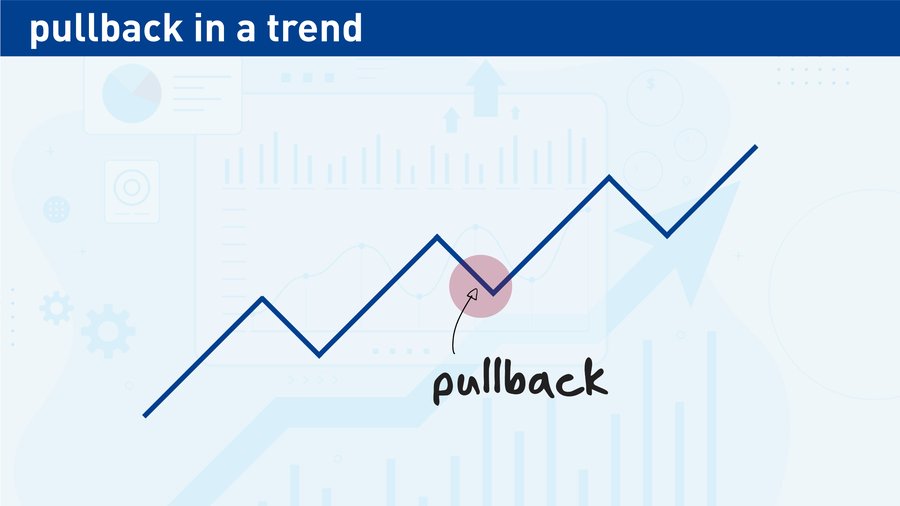
When you enter a trend on a pullback, you want to see the MACD histogram register in the direction of the pullback.
- To enter an uptrend, wait for the price to pull back down and for the MACD histogram to be below the zero line.
- To enter a downtrend, wait for the price to pull back up and for the MACD histogram to be above the zero line.
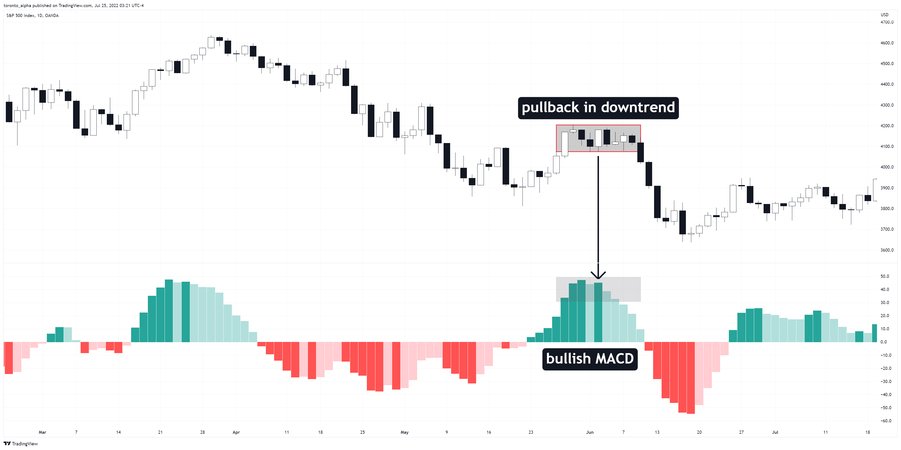
How to avoid a bad entry:
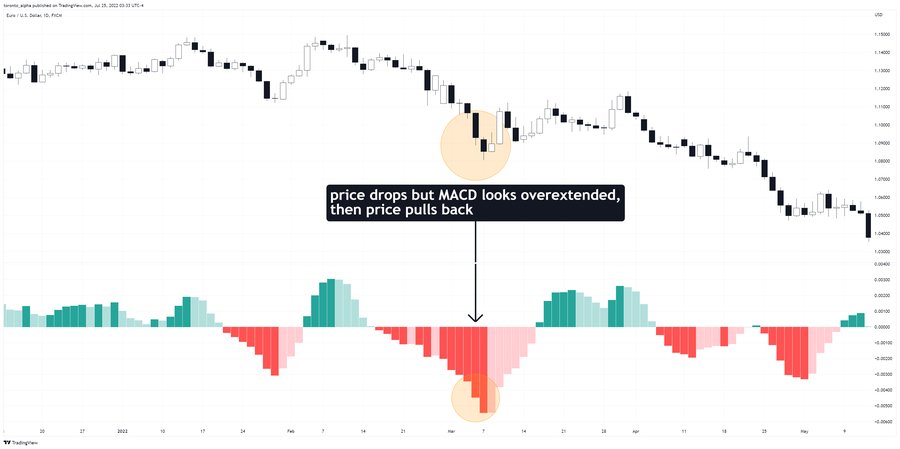
Sometimes traders will enter as the price is moving quickly in the direction of a trend, afraid they will otherwise miss the move. This “FOMO” (fear of missing out) driven trading is dangerous for two reasons: you will often need a larger stop loss, and you could be entering before a pullback that quickly has you sitting in a losing position.
To avoid these problems, do not enter a trend when the MACD is over-extended in the direction of the trend. Instead, wait for the price to pull back. The extra wait will often let you enter at a better price.
Other MACD Strategies
Another popular strategy is to enter when the MACD line crosses the signal line—many traders consider this to be the “classic” MACD strategy.
- When the MACD line crosses the signal line from below to above, the signal is bullish.
- When the MACD line the signal line from above to below, the signal is bearish.
The further away the crossing point is from the zero line, the stronger the signal. It is important not to trade this signal blindly. Only use this signal with price action confirming. For example, when you see confluent support or resistance that should help the trade, or if the setup is pointing in the same direction as the prevailing trend.
Limitations of the MACD Indicator
I find there are two considerable limitations with MACD:
- MACD is a lagging indicator. It is derived from moving averages which themselves lag price. Although MACD is more sophisticated than moving averages by themselves, it can still lag. That is why combining MACD with price action is essential to prevent multiple false readings.
- Filtering with MACD means you will miss some good trades. That is always a risk when using any indicator. For example, the price may not pull back very far in a strong trend and therefore not register on the MACD indicator as a pullback.
- MACD works best in trending markets. When markets are stuck in a range rather than a likely pause in a trend, MACD strategies often generate many poor-quality signals. Therefore, it is so important to be aware of the long-term price action in whatever you are applying the MACD indicator to.
Bottom Line
The MACD indicator is a powerful momentum detector. You can use it to find trade entries and even exits if you find the momentum is turning against you. However, like any technical indicator, the MACD has limitations and can give unreliable signals if used in the wrong context. To use the indicator most effectively for successful high-probability trading, it is important to:
- Pay attention to the long-term trend, or lack of one.
- Trade only in the direction of the long-term trend if there is one.
- If there is no trend, only look for long trade entries near likely key support areas, and short trades near likely key resistance areas.
- Remember that the presence of abnormally large, expanding bars in the MACD histogram is probably the most reliable entry signal which can be given by the indicator, ideally followed by a pullback which quickly fails.
- Only take an MACD signal if the naked price chart supports it (the candlesticks or price bars should look attractive and telegraph momentum on their own).
FAQs
Is the MACD a good indicator?
MACD is one of the best tools to track momentum, and it is especially powerful when you combine it with price action, support & resistance, and trend analysis.
What is a good MACD value?
The most popular MACD values are 12 (fast EMA), 26 (slow EMA), and 9 (signal line). Trading platforms usually have this as the default setting. The signal line can be either an SMA or EMA.
When should you buy with the MACD?
You can buy or enter a trade when the MACD indicator shows momentum in the direction you need.
Is the MACD good for swing trading?
MACD is more popular with short-term traders but is equally valid on swing trades using higher timeframes, e.g., 4-hour.
How do you use the MACD indicator effectively?
Use the MACD indicator in conjunction with price action to measure momentum and find trade entries. The relative length of the MACD Histogram is an excellent way to read momentum.
What is the red line in MACD?
In MetaTrader MT4, the red line shown by the MACD indicator is usually the signal line.
What is the MACD used for in Forex?
The MACD indicator in Forex tells you when a currency pair has strong or weak momentum and can help enable you to find trade entries and exit points.
How do you read an MACD indicator in Forex?
When the MACD histogram bars grow longer, this tells you the price has increasing momentum. When the bars are getting shorter, there is shrinking price momentum. Another way to read the MACD Indicator is when the MACD line crosses the signal line from above to below, it is a bearish signal, and vice versa for a bullish signal.
