The Ichimoku Cloud Indicator is one of the most unusual indicators in technical analysis—it looks unlike any other standard indicator, and its construction feels entirely different. Even though it is dissimilar from other technical analysis tools, the Ichimoku Cloud indicator has a loyal following amongst a sizable portion of traders.
Ichimoku users claim the indicator gives a wealth of information compared to other tools: it shows potential support and resistance areas, the price related to sentiment, and its current momentum.
Let’s explore how the Ichimoku Cloud indicator works, what it tells traders about future price direction, and how to use it as a strategy.
What is the Ichimoku Indicator?
The full name of the indicator is ‘Ichimoku Kinko Hyo,’ which translates to ‘one look equilibrium chart’—the idea being that the chart gives an immediate window into the market’s equilibrium—where it lies in relation to support and resistance, sentiment, and momentum.
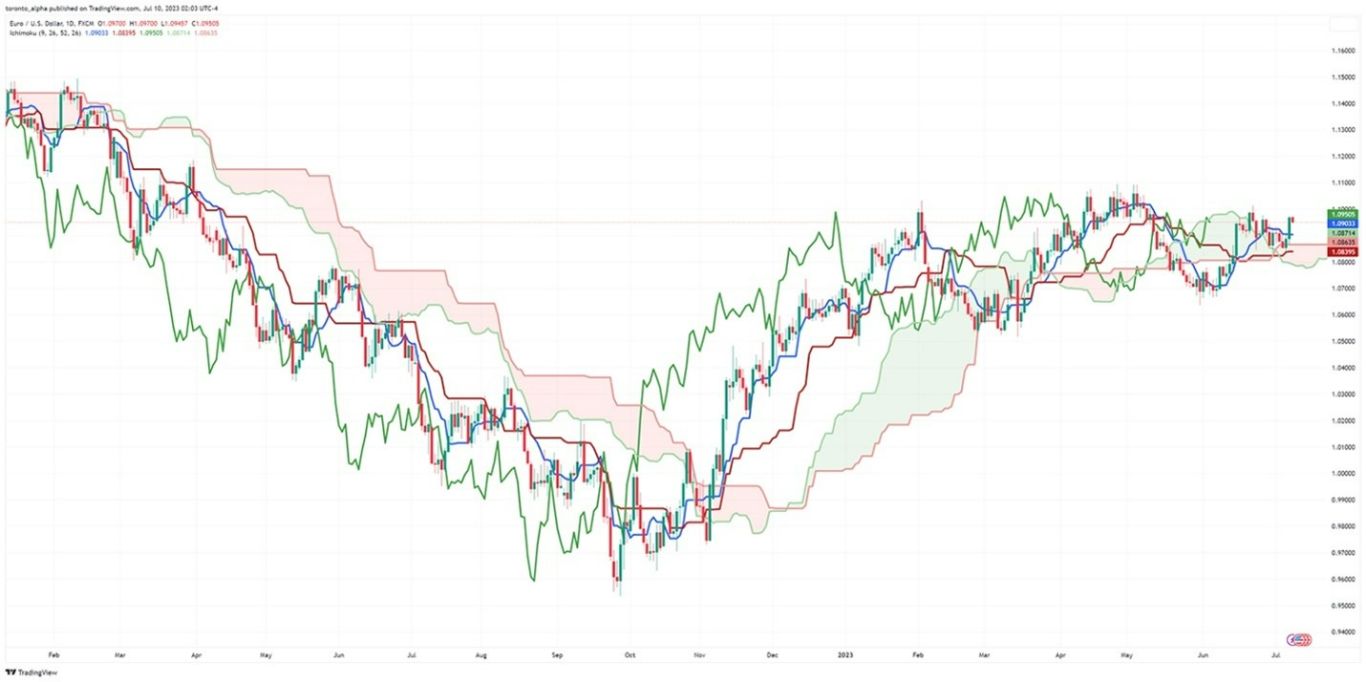
The Ichimoku indicator can seem intimidating because of the number of lines and shapes it contains. But it’s made up of just four components: Conversion Line or Tenkan Sen (Blue Line), Base Line or Tenkan Sen (Red Line), Chikou Span (Green Line), Senkou Span (Ichimoku Cloud).
Let’s go through each one.
The Four Inputs of the Ichimoku Indicator
- Conversion Line (Tenkan Sen)—Blue Line
The average of the highest high and lowest low over the last 9 periods (as a standard setting).
- Base Line (Kijun Sen)—Red Line
The average of the highest high and lowest low for the last 26 periods (as a standard setting).
- Leading Span B (Senkou Span B)—one boundary of the cloud
The average of the highest high and lowest low over the last 52 periods (as a standard setting) plotted 26 periods into the future. This forms one boundary of the cloud.
- Lagging Span (Chikou Span)—Green Line
The closing price plotted 26 periods (as a standard setting) in the past.
The standard settings for the period lengths above are often abbreviated to 9/26/52/26.
Leading Span A (Senkou Span A)—the second cloud boundary: This is formed by the average of the Conversion Line (Tenken Sen) and Base Line (Kijun Sen).
Note: I have listed the standard colours that most trading platforms give each line. Check your platform to see which colours it assigns to each line.
How Do I Add the Ichimoku Cloud Indicator in MT4?
Go to Insert > Indicators > Trend > Ichimoku Kinko Hyo from the top menu bar.
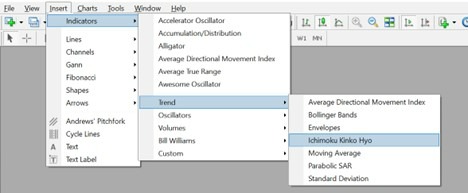
Some versions of MT4 do not show the Lagging Span (Chikou Span) line. But other platforms, such as TradingView, do show it.
Adjusting the indicator’s parameters and colours.
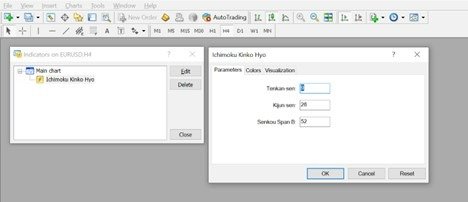
MetaTrader allows users to adjust the settings on the Ichimoku indicator:
- Right-click anywhere on the chart, and a pop-up menu appears.
- Go to “Indicator List.” You can also access it through CTRL + I.
- In the new sub-window that appears, double-click “Ichimoku Kinko Hyo.”
Or double-click precisely on one of the Ichimoku Indicator lines on the chart.
In the Parameters tab, users can change the period settings, and there are tabs for colours and which timeframes the indicator will appear.
How Do You Use Ichimoku Effectively?
Conversion and Base Lines Crossovers
Because the Conversion and Base Line calculations resemble standard moving averages (e.g., SMA, EMA), traders can use them like moving averages.
Most traders use two moving averages as a crossover signal, and that’s exactly how Ichimoku traders treat the Conversion and Base Lines.
- If the Conversion Line crosses the Base Line from below to above, it is a bullish signal.
- If the Conversion Line crosses the Base Line from above to below, it is a bearish signal.
This is one of the easiest ways to start using the Ichimoku Indicator and evaluate its effectiveness on a chosen market and timeframe. I can scroll back on charts to see how price reacts when the lines cross.
The Ichimoku Cloud
Remember, one barrier of the cloud is formed by the Lagging Span (Chikou Span) and the other by the Leading Span A (which is simply the average of the Conversion and Base Lines).
When the cloud is thicker, the price action is more volatile. A thinner cloud means less volatile price action.
The idea is that the Cloud acts as support and resistance zones to the price. For example, I can wait for the price to bounce against the Ichimoku Cloud as a support or resistance zone. Or, if I am anticipating a breakout, I can wait for the price to break through the cloud and expect it to continue its momentum.
The Cloud is harder to back test than the Conversion and Base Lines crossing because it is much more subjective. But visually scrolling through a chart will give me a good sense of whether there is a relationship between the price and the Ichimoku Cloud.
Lagging Span
This is the least used of the Ichimoku Indicators, and some MT4 versions do not display it. Traders sometimes use it to show bullish or bearish sentiment:
- When the price is above the Lagging Span, the sentiment is bullish.
- When the price is below the Lagging Span, the sentiment is bearish.
What is the Best Time Frame for Ichimoku?
4 hours and higher are more reliable for Ichimoku trading.
Like almost all technical analyses, higher timeframes represent more reliable moves than lower ones. This principle applies to the Ichimoku Indicator. The daily, weekly, or monthly time frames are better suited to Ichimoku trading than 1-hour or 15-minute timeframes.
Ichimoku Trading Strategies
The Ichimoku Cloud Strategy
Core Strategy Principle: The Ichimoku Cloud acts as a support or resistance zone to the price.
Using this core Ichimoku strategy principle, here are two ways of using the Ichimoku Cloud:
- Trade in the direction of the larger trend and use the Cloud as support or resistance on pullbacks. For example, the price could pull back in an uptrend, use the Ichimoku Cloud as a support, and then continue in the direction of the trend.
- Wait for the market to make a consolidation or reversal pattern, and then break through Ichimoku Cloud. In this strategy, the Cloud acts as a confirming indicator.
Ichimoku Trading Strategy Examples
Let’s look at two examples, both using the standard Ichimoku settings.
Example 1: The price bouncing off the cloud in an uptrend
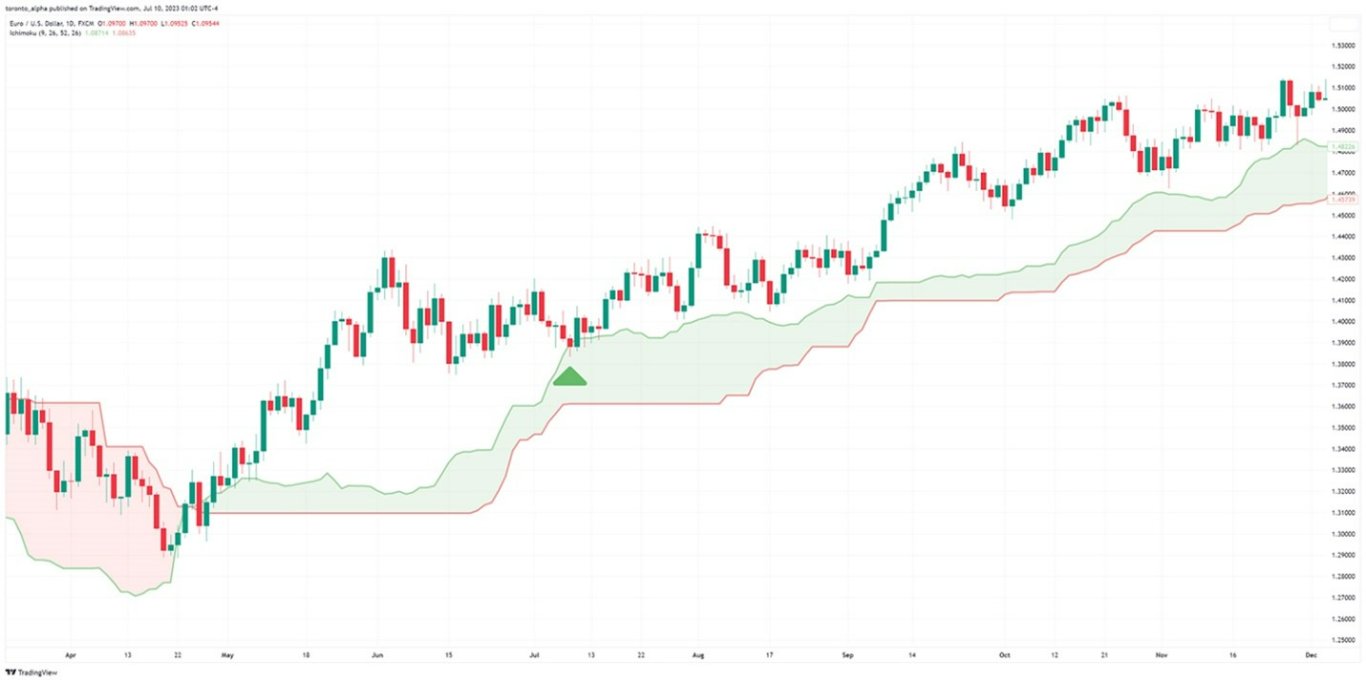
- A new uptrend is underway.
- The market pulls back until it finds the Cloud providing a long entry.
- The price continues to rise by over 1,000 pips.
Example 2: EUR/USD Daily Chart
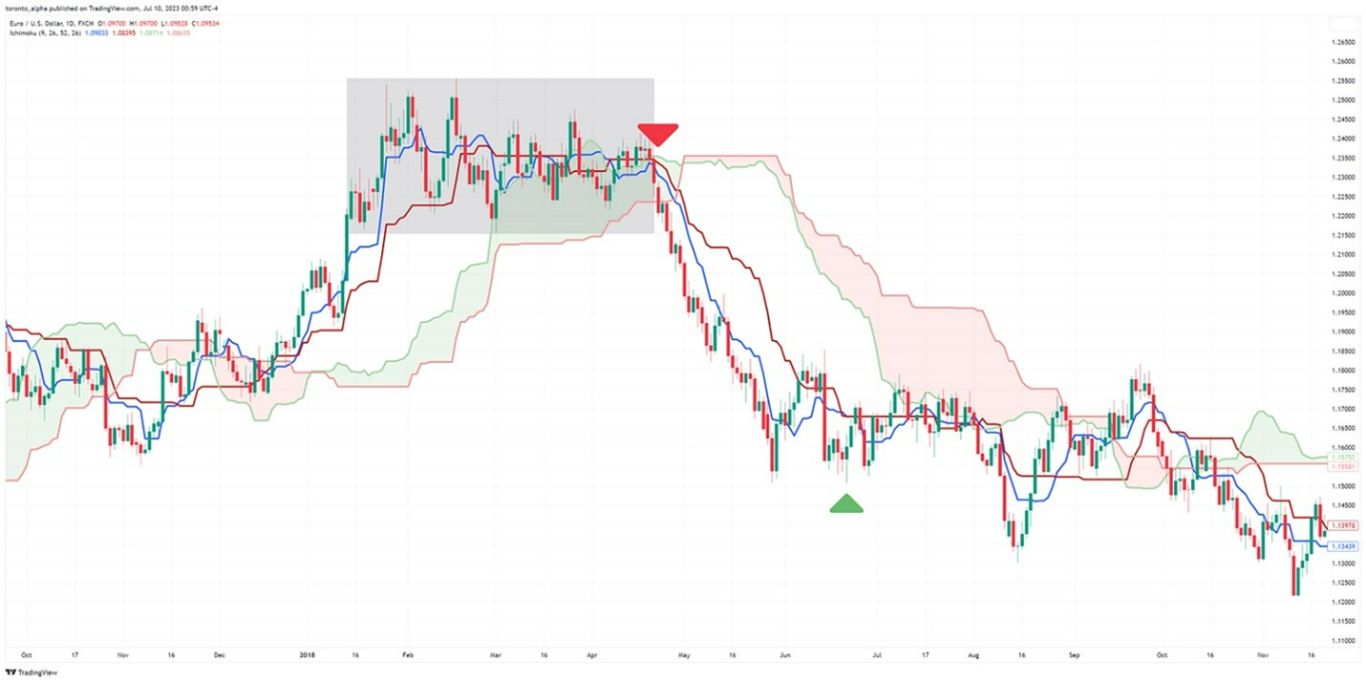
- The market consolidates (grey box).
- The Cloud is supporting the price in the consolidation area.
- The market breaks through the Cloud to signal a short entry (red arrow).
- The market falls about 700 pips.
- The Conversion Line and Base Line crossover can be used as an exit signal (green arrow).
Ichimoku Strategies— Pros & Cons
Pros
- Compared to traditional Moving Averages, the Ichimoku Cloud incorporates more data points by using highs and lows rather than just closing prices.
- They can provide entry and exit signals using the Cloud, Conversion, and Base Lines.
- Unlike traditional support and resistance zones, I do not have to draw the levels out.
Cons
- Ichimoku Indicators are modified moving averages with the same disadvantages as traditional moving averages—they are lagging indicators and do not perform well in choppy or rangy markets.
- They are discretionary, and two traders using the same Ichimoku settings may produce different trades.
- They should be considered only within the wider price action context, e.g., trends, and not traded blindly.
Which Other Technical Indicators Work Best with Ichimoku Strategies?
Ichimoku does not have to be traded in isolation, and traders can use other tools to help confirm the trades. For example:
RSI—The RSI indicator helps confirm overbought or oversold conditions.
MACD—This popular indicator is an excellent tool for showing momentum in trends.
Traders can use the RSI and MACD to help confirm the bullish or bearish readings from the Ichimoku indicators. These two indicators are particularly useful in combination with the Ichimoku indicator.
Bottom Line
The Ichimoku Kinko Hyo indicator shows traders a wealth of information. It is comprised of four components: Conversion Line, Base Line, Leading Span B, and Lagging Span. The calculations in the Ichimoku Indicators are like moving averages. Still, they are more sophisticated by taking in highs and lows rather than only closing prices.
Together, the Ichimoku Indicators form support and resistance zones and show momentum.
Ichimoku Indicators are discretionary and should be traded with price action in mind. They are better suited for larger timeframes such as daily and above.
FAQs
What is the best timeframe to use with Ichimoku?
Timeframes daily and above are the most dependable for Ichimoku trading.
What is the best way to trade Ichimoku?
The Ichimoku Cloud is best used as a support and resistance zone, and the Conversion and Base Lines are best used as crossover momentum.
What is the win rate of the Ichimoku trading strategy?
There is no set win rate because Ichimoku can be used with different markets, timeframes, and settings.
How accurate is Ichimoku?
Because Ichimoku is a discretionary indicator, its accuracy will depend on the trader's interpretation skills.
Does the Ichimoku Cloud predict the future?
Ichimoku Cloud shows support and resistance areas traders can use for future price direction.
Can Ichimoku be used alone?
Yes, some traders do use Ichimoku by itself.
What is the disadvantage of Ichimoku?
The main disadvantage of Ichimoku is that it is discretionary and uses lagging price data like moving averages.
What are the 5-day settings for Ichimoku?
The default settings 9-26-52 can be adjusted for a 5-day workweek using 8-22-44.
Is Ichimoku a leading or lagging indicator?
Ichimoku is a lagging indicator.
Does Ichimoku work for day trading?
Ichimoku works best for longer-term trading using daily timeframes and above.
What are normal Ichimoku settings?
Normal Ichimoku settings are Conversion Line: 9. Base Line: 26. Leading Span B: 52. Lagging Span: 26. This can be abbreviated to 9/26/52/26.
How do you read Ichimoku?
The Cloud is a support and resistance zone, and the Conversion and Base Lines are a crossover signal.
