Support and resistance (“S/R”) is part of the foundation of technical analysis. Think about trends which are a series of rising support levels or lowering resistance levels. Or chart patterns formed through a series of support and resistance levels. Or Fibonacci, which means identifying the correct support and resistance levels to use as starting points.
Even traders who predominantly use indicators to make decisions will mark out significant support and resistance levels on the chart to guide their trading.
Too often, new traders skip developing a deep understanding of support and resistance analysis and go straight to indicators and systems in the hope of finding a holy grail setup that magically produces profitable trades.
It is short-sighted to ignore support and resistance because it is easily the best simple way to understand the market and plan trades. I can use support and resistance in any market during any period. A Forex chart in 2023? No problem. A stock chart from the 1950s? Also, no problem. Remember, all indicators are derived from price. Support and resistance are not derived from the price but from a human analysis of price action.
Read on to learn how to use support and resistance in trading for more profitable trading results.
What is Support and Resistance?
A basic definition of support and resistance:
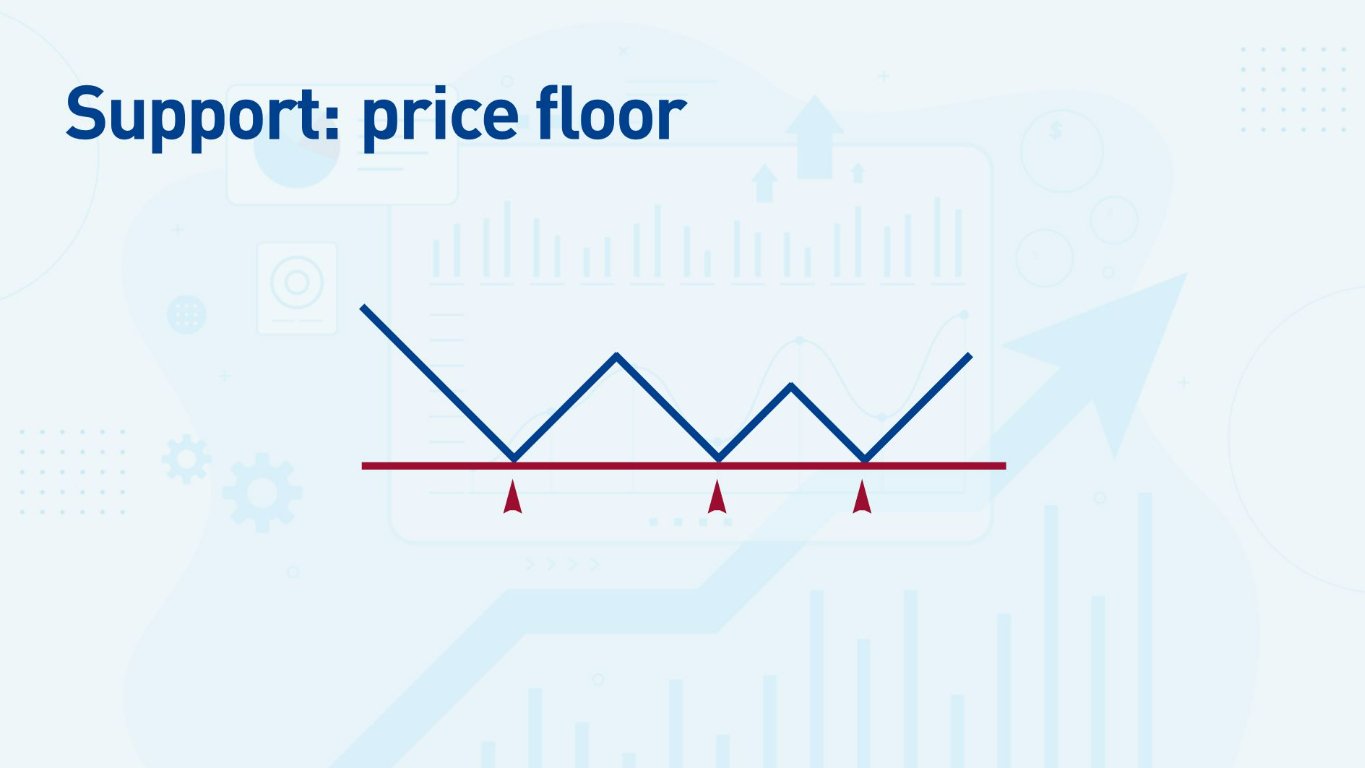
- Support is a level to which the price moves down and bounces up, creating a floor.
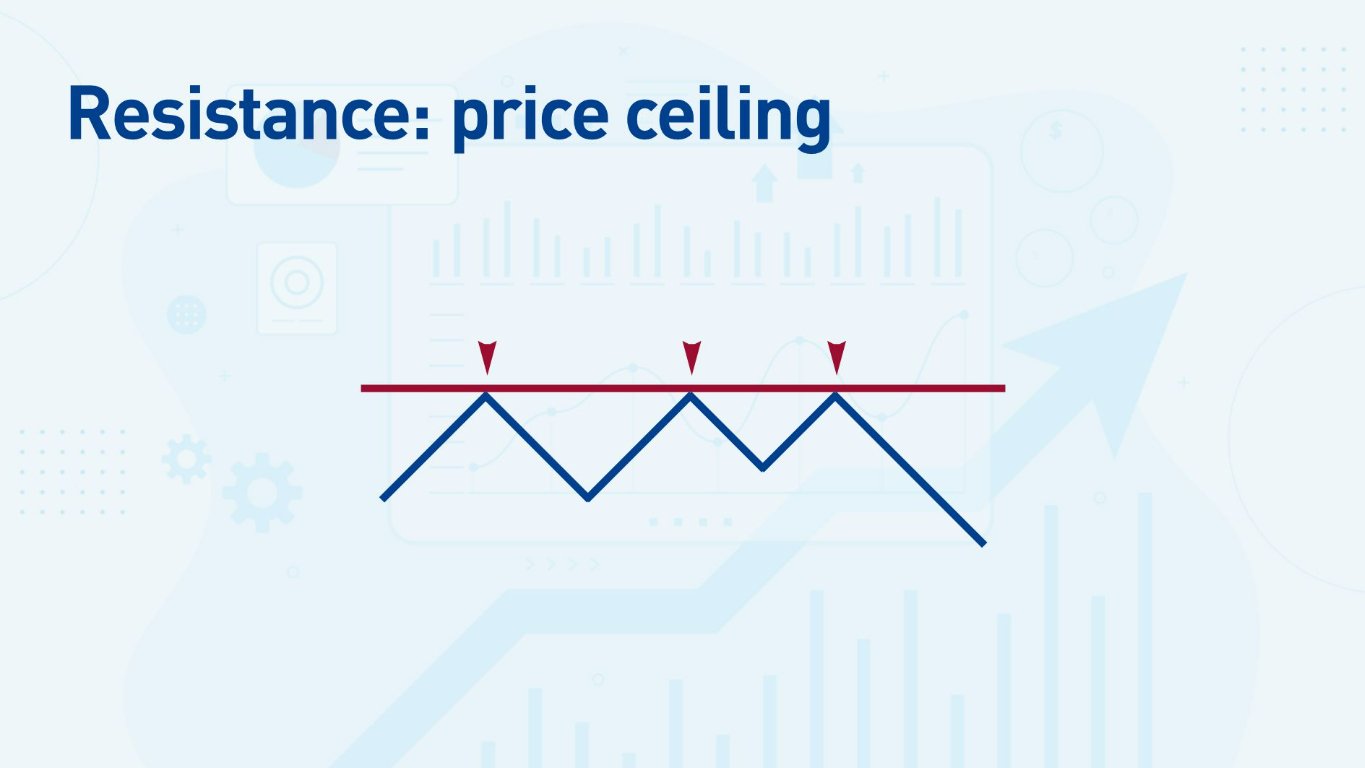
- Resistance is a level to which the price moves up and bounces down, creating a ceiling.
After the bounce, the price may move sideways, or move in the opposite direction creating a new trend.
I use support and resistance to trade Forex and other markets—stocks, futures, crypto, etc.
A support or resistance level can have a single bounce.
There is a common belief that the price must bounce more than once to create a support or resistance level. But a level can have just one bounce to create an S/R level.
A large bounce is as important as multiple smaller bounces.
If the price bounces off a level significantly, for example, it retraces hundreds of pips on a daily chart, I consider that a significant level even if it is one bounce.
Timeframes
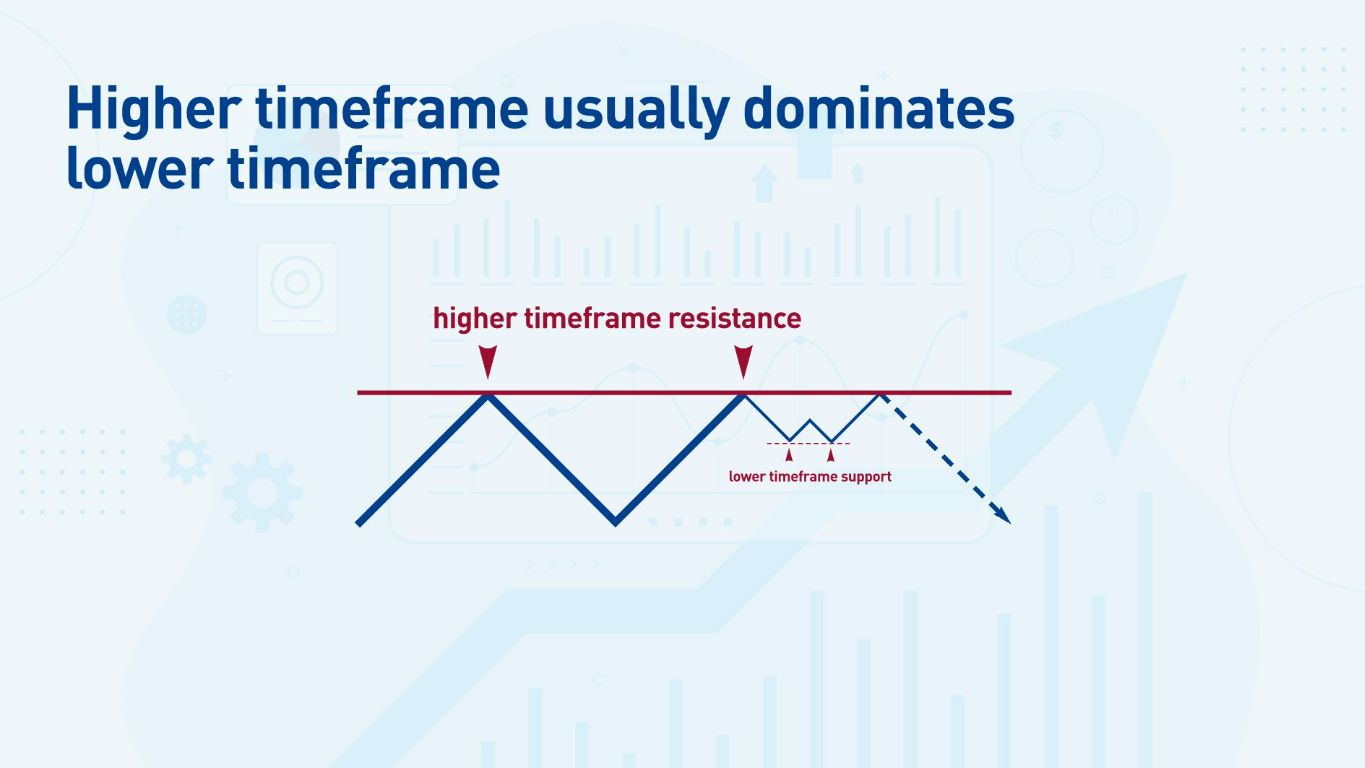
Identifying support and resistance on a chart depends on the timeframe I am looking at. I may spot an S/R level on an hourly chart, but it could be too small to see on a daily chart. Usually, higher time frame levels are stronger than lower time frame levels.
Support and Resistance Levels and Zones
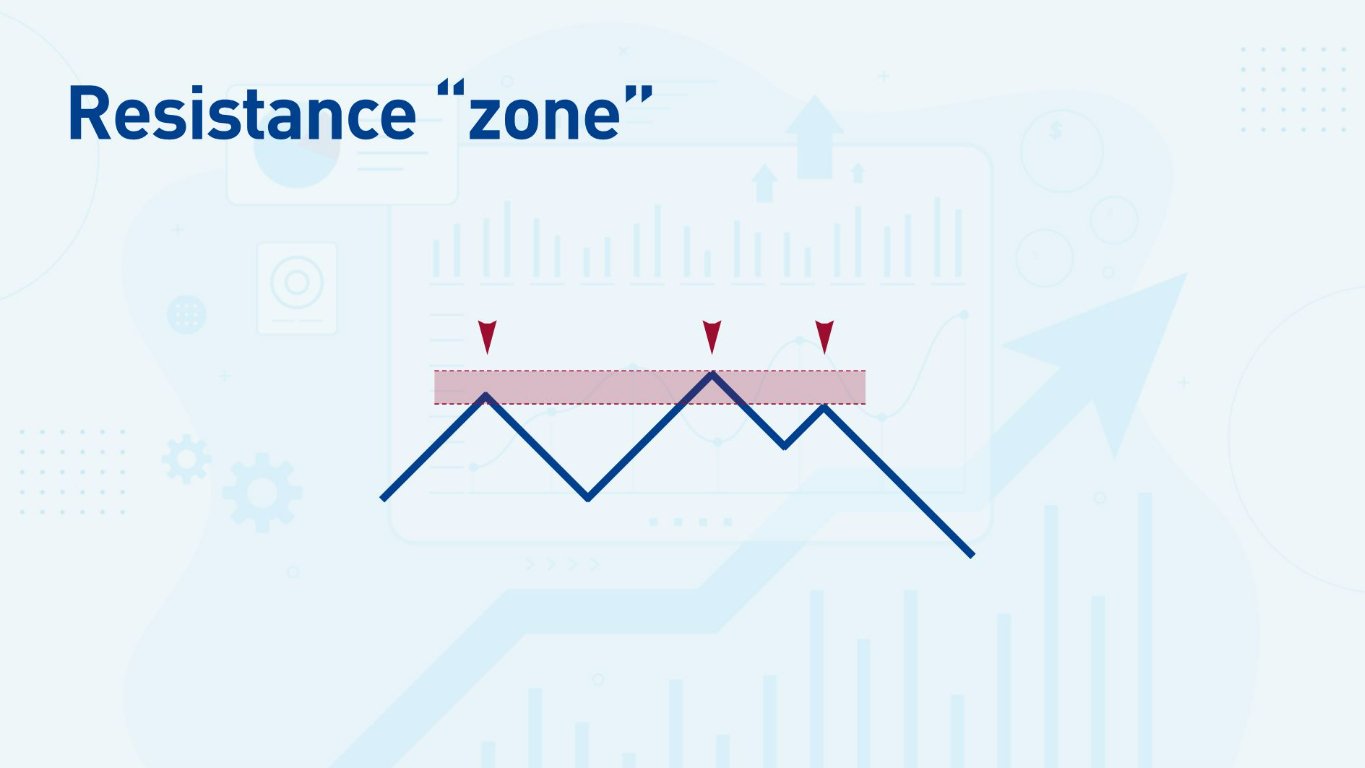
Most S/R areas are zones, not precise levels.
Of course, charts are not always neat and tidy, and the price does not always bounce against the same level precisely. Often, the price will bounce near a previous level—sometimes missing it and sometimes breaching it. Support and resistance levels are usually zones, rather than exact price levels.
How Do We Truly Know if Support or Resistance is Broken?
This is the million-dollar question, and even when a setup looks perfect, the price can still make ‘false breakouts’—where the price breaks through an S/R level temporarily, only to return back to the former area.
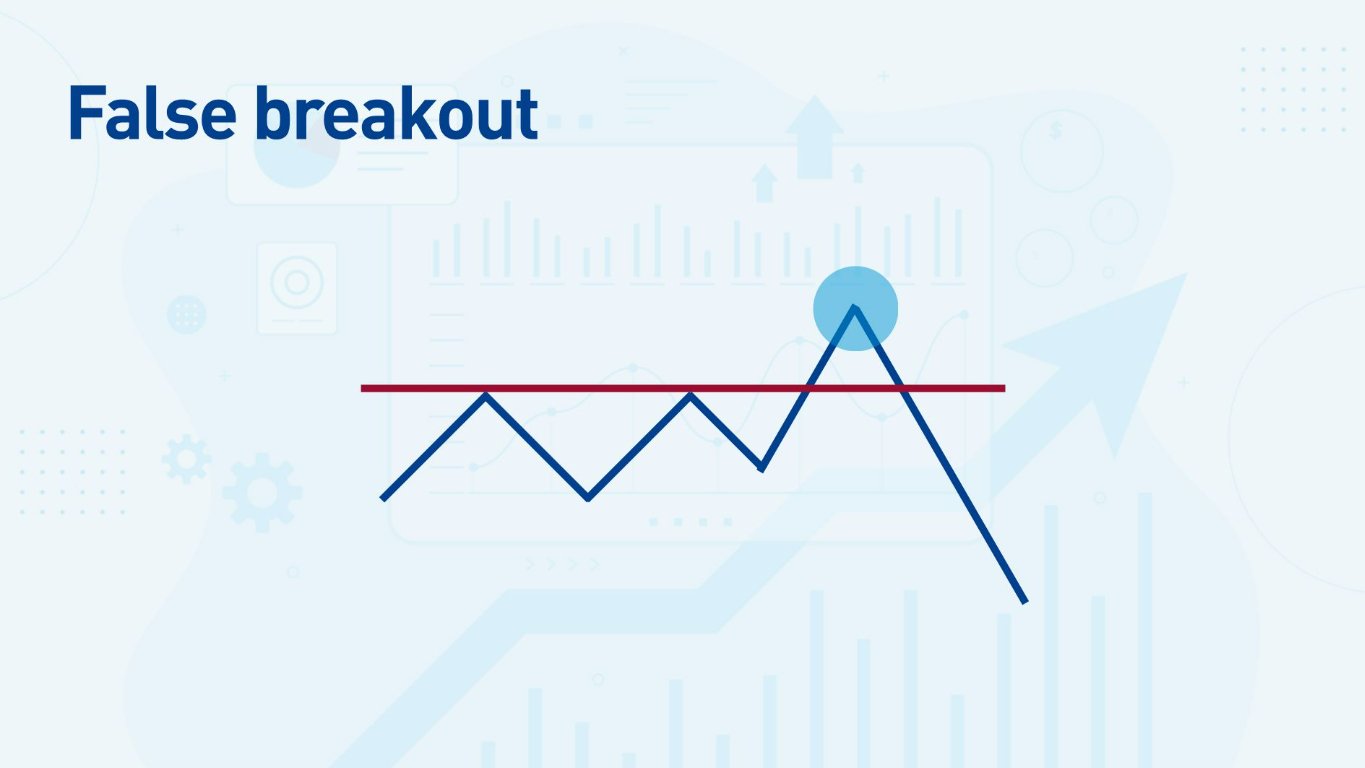
There are two methods I use to confirm whether a breakout is real or false:
- A long bullish or bearish candle piercing the level. I want to see the price ‘thrust’ through with at least one long candle, which shows me that there is substantial buying or selling pressure to leave the area of support or resistance.
- A retest of the S/R level. This means the price returns to the level after breaking it and re-tests it from the other side. For example, if the price breaks through a support level, it returns and bounces against that same area as a resistance level. I find some of my best trades using this method, so I have devoted an entire section to it in this article.
Let’s look at an example of a false breakout followed by a real breakout at the same support level on this EUR/USD daily chart.
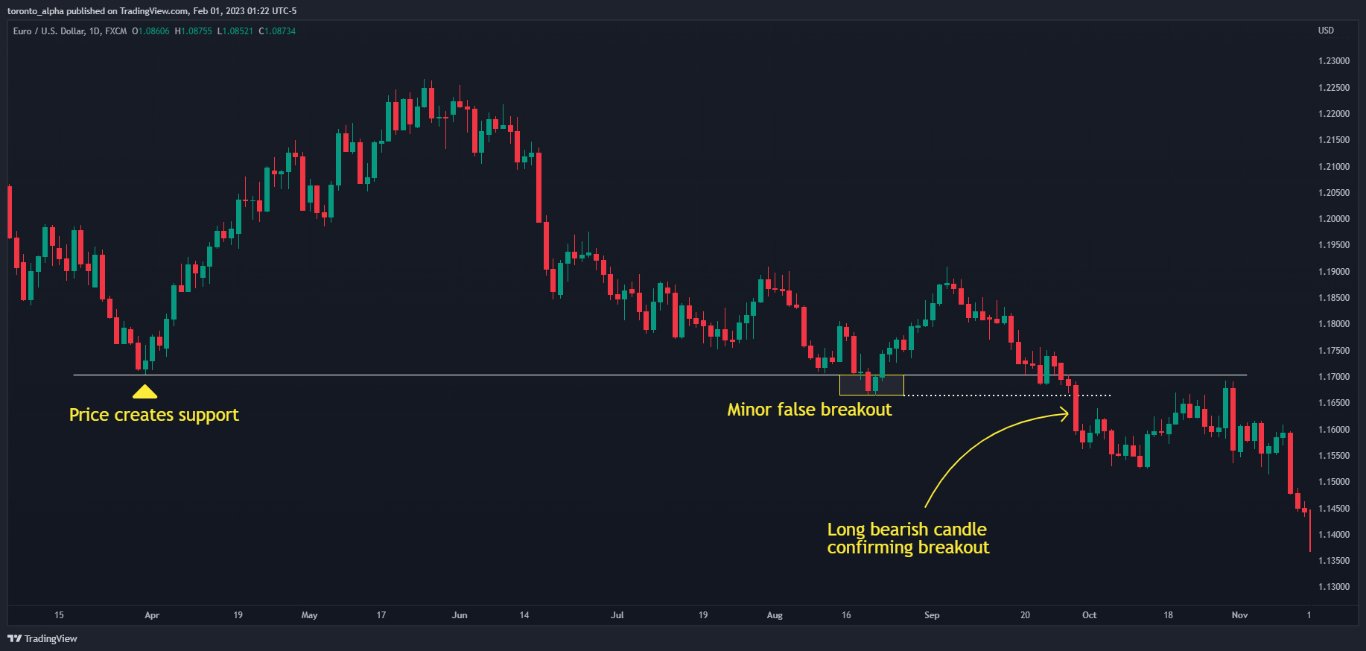
- First, the price makes a support level.
- When the price returns to the support level, it briefly goes through it but then goes back up, creating a small false breakout.
- Then the next time the price returns to the support level, it thrusts through with a long candle as if to say, “Hey, I’m not tricking you this time!”
Examples of Support Becoming Resistance / Resistance Becoming Support
A key concept in technical analysis is that support often turns into resistance (or vice versa) when the price breaks it - its ‘role’ is reversed.
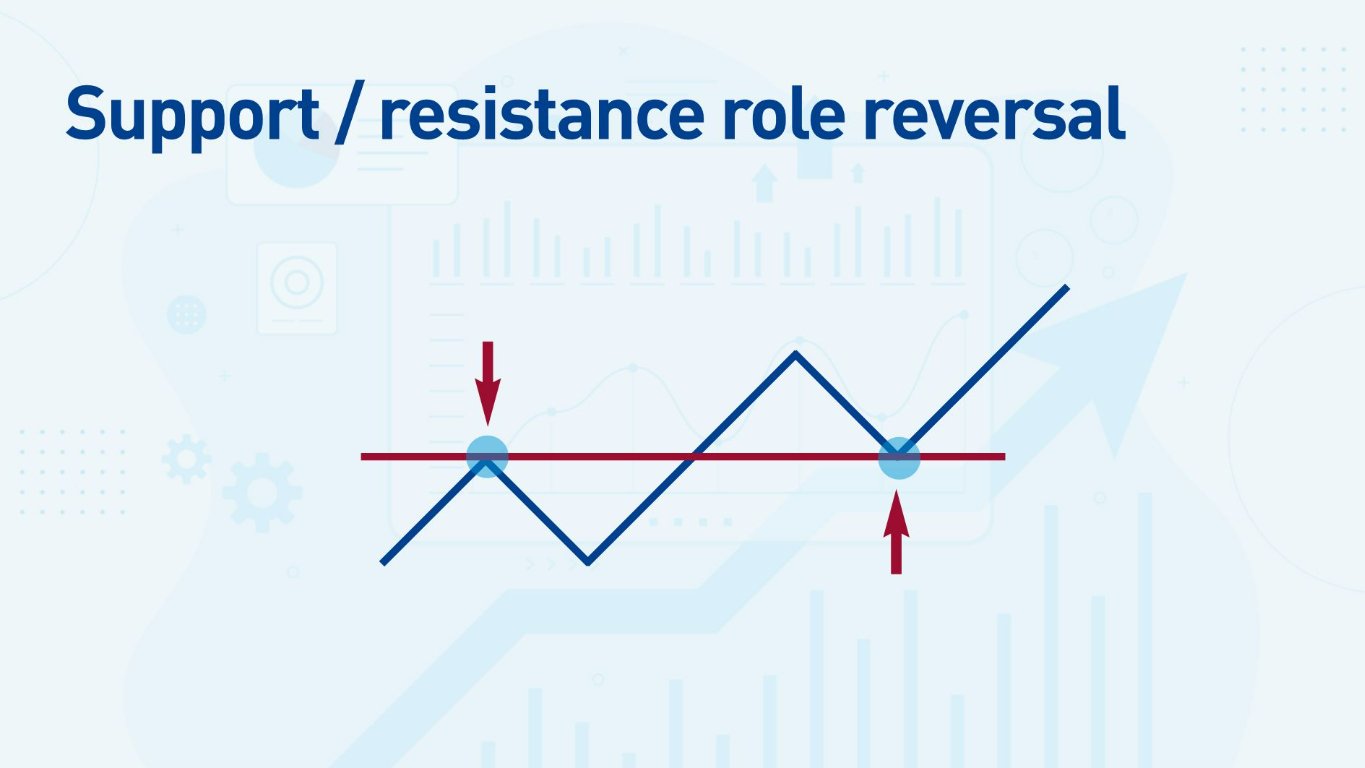
S/R role reversal is an excellent setup—I trade it both by itself and as part of a larger strategy.
Let’s go back to the EUR/USD daily chart we looked at earlier because it shows an excellent example of a broken support level turning into resistance.
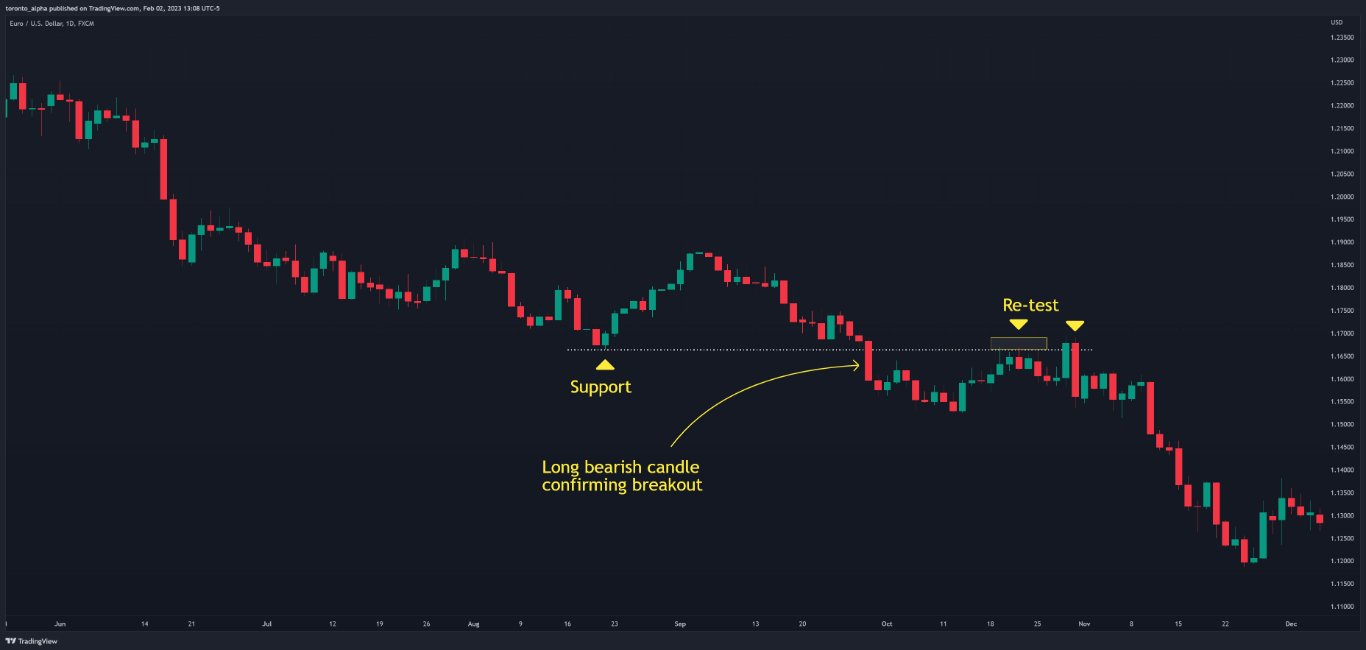
- A long bearish candle convincingly breaks the support. I like to see the price move swiftly away from the level as the first sign that it’s a real breakout. This is not a guarantee—the price can still move swiftly back in the opposite direction to create a false breakout, but that does not happen often.
- The price then moves back up and re-tests the previous support level, turning it into a resistance level. It has several candles touching the level multiple times, giving traders confidence in the new resistance level and plenty of opportunities to enter the market.
- Notice how a long bullish candle breaks through the resistance but is immediately followed by a long bearish candle. It is a “false” break of the resistance, and I am sure plenty of short traders got stopped out in that move. However, this reconfirms the validity of the resistance and strengthens it. After the false break of the resistance, the market moved down by hundreds of pips. It’s a lesson not to make stop- losses too tight!
Let’s look at another example: this time, resistance is turning into support on an EUR/USD weekly chart.
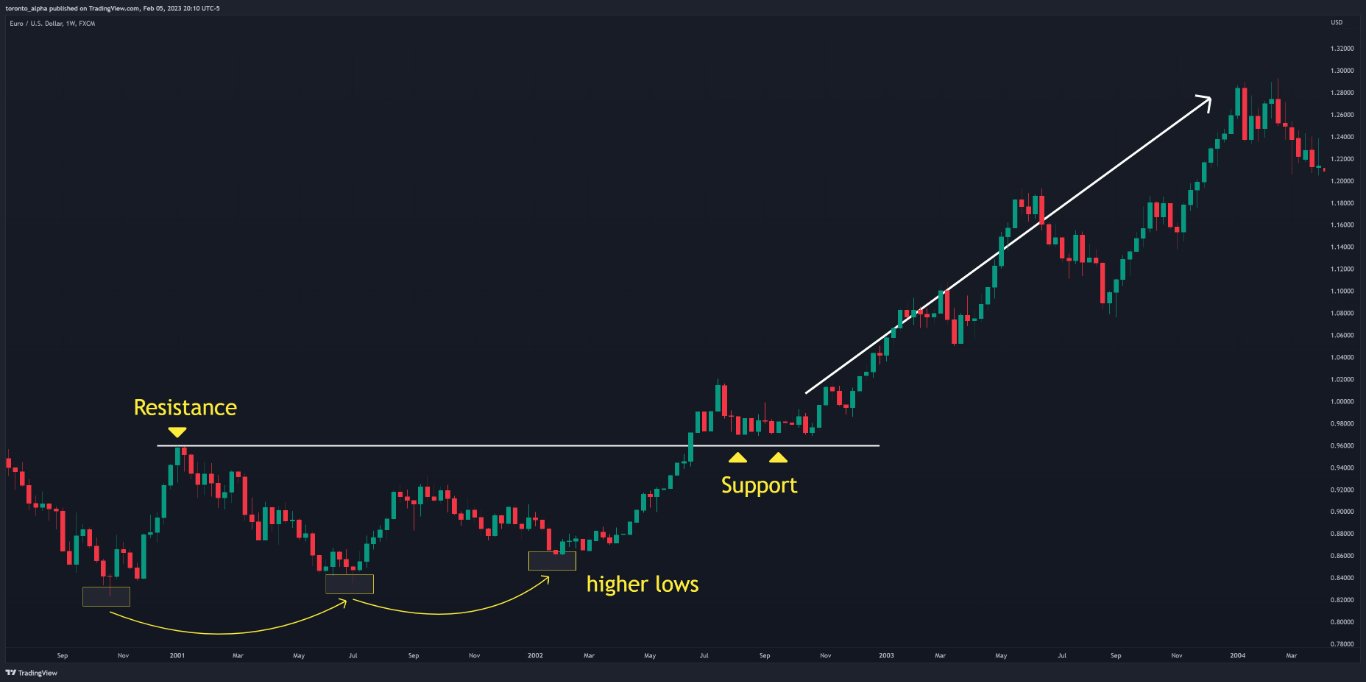
- The price was moving sideways (after a downtrend) and created a resistance level as part of the sideways range.
- The price then made a few higher lows, indicating bullishness. It eventually broke through the resistance with a couple of long green candles.
- After breaking through the resistance, the price went sideways, using the level as a support. This S/R role reversal gave me a long entry into the market. From there, the market began a new uptrend lasting over a year!
Minor vs. Major S/R Levels
What makes some S/R levels more important than others?
- Higher timeframe S/R levels are stronger. That’s because more trading activity or volume is needed to create a higher timeframe S/R level, indicating more sentiment behind that level. How does that affect my trading? For example, if I am taking a long trade on a 4-hour chart, I don’t want to be trading into a nearby resistance on the weekly chart.
- The further the price bounces away from an S/R level, the stronger it is.
- The more a level is tested, the stronger it is. Multiple bounces against a level make a level stronger. Remember though, that a single large bounce against an S/R level is often better than multiple smaller bounces.
How To Trade Support and Resistance
There are many ways to trade support and resistance. Here are some of the most popular methods.
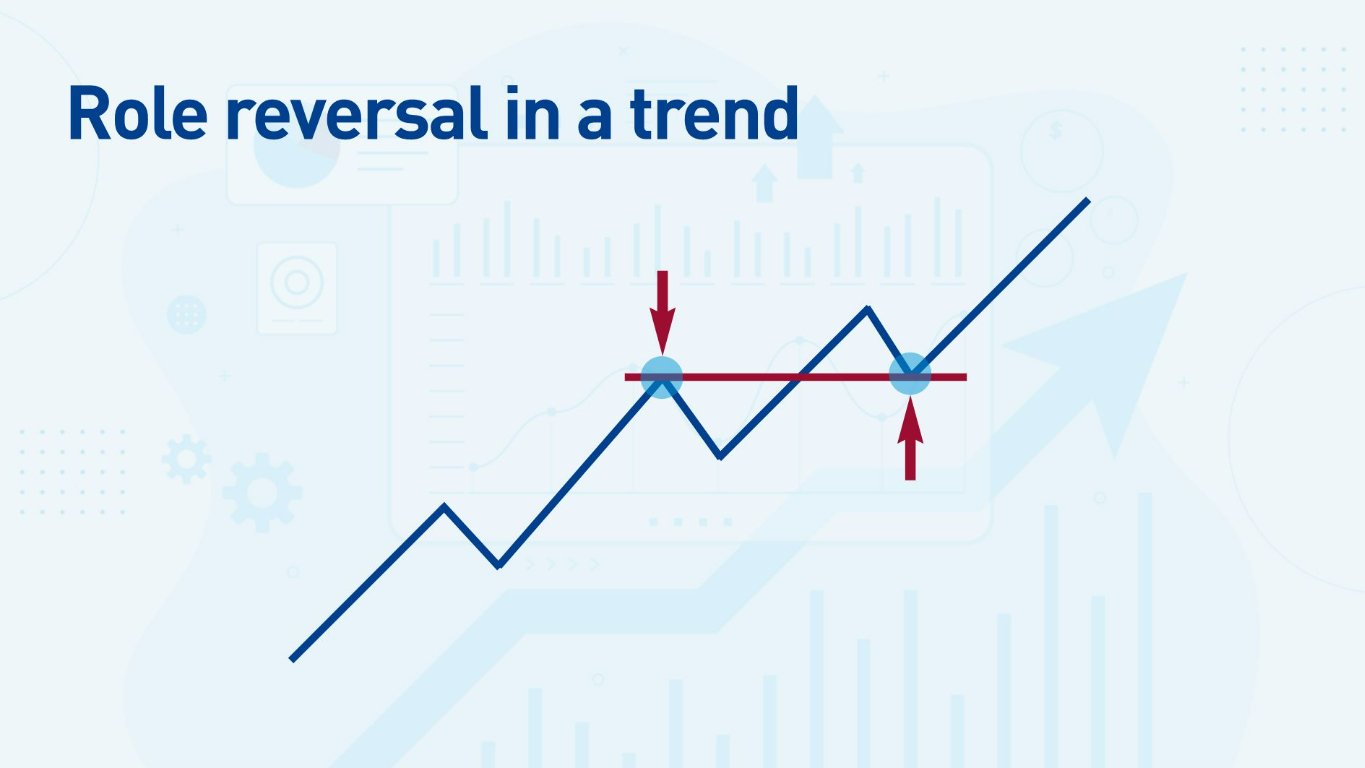
- Trend trading: Trends are simply a rising or falling succession of S/R levels. Using S/R role reversal can help find entries within a trend. For example, I wait for the resistance to break in an uptrend and turn into support for an entry.
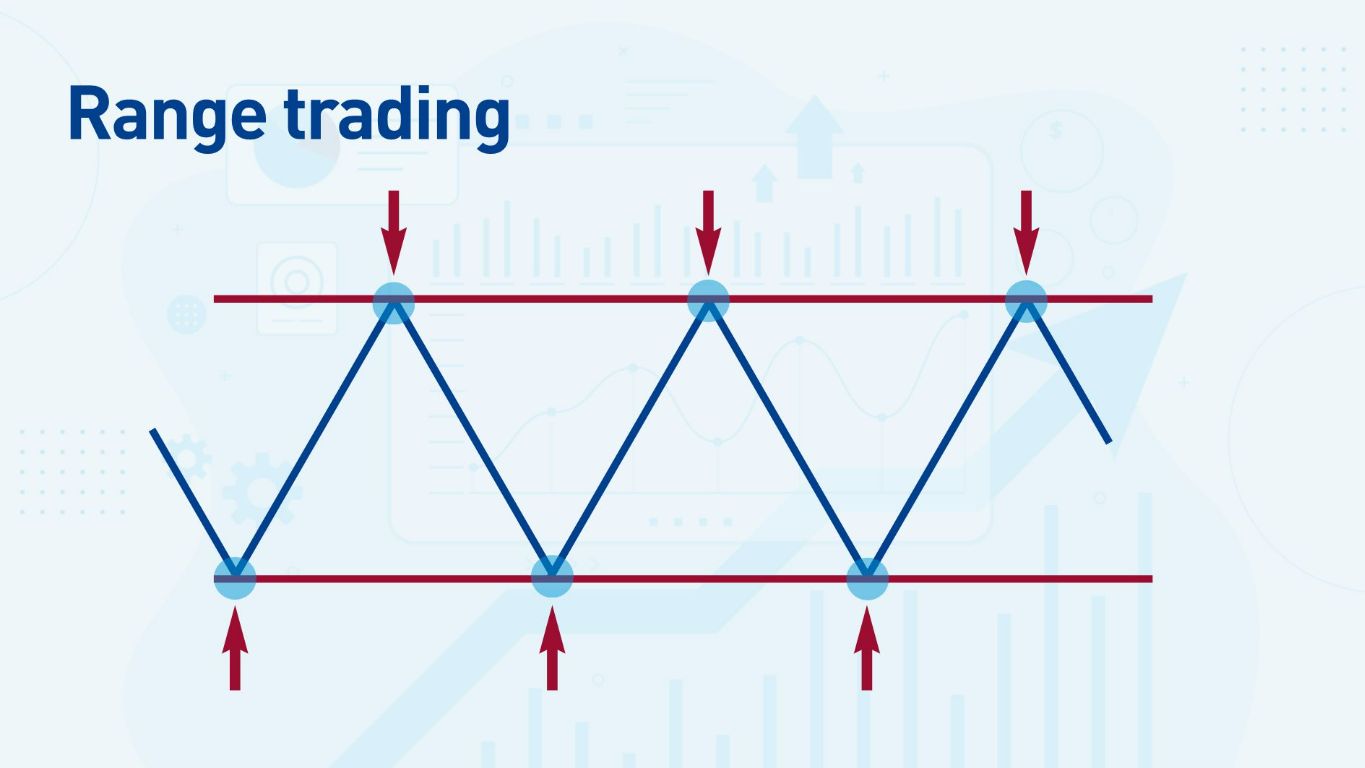
- Range trading: A range is a sideways price action with parallel support and resistance lines. Trading a range simply means buying at the support and selling at the resistance. I might only trade one side of the range if I believe the price will break out of the other side. For example, if the higher timeframe is bearish, I may only take short positions from the top of the range.
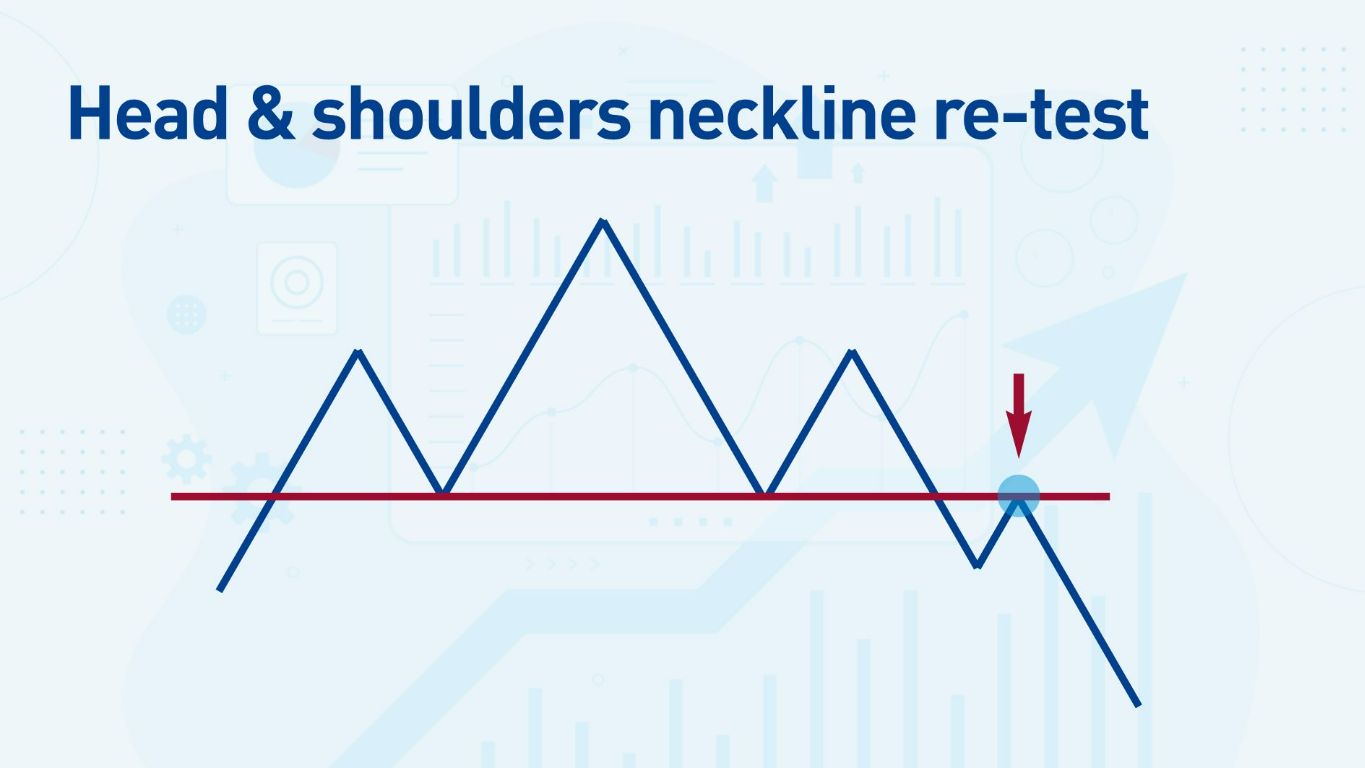
- Chart patterns. S/R levels are found in chart patterns, particularly head and shoulders reversals. When price tests the ‘neckline’ of a head & shoulder pattern, it can provide an excellent trade entry.
A Support and Resistance Trading Strategy
Step 1: The first thing I do when I pull up a chart is to look to the left and ask, “When did the price last bounce against a level in a significant way? If the price has been moving down, I look for a major support level, and if the price is moving up, I look for a significant resistance level.
Step 2: I go up one timeframe and repeat Step 1. I want to ensure I do not run into an S/R level further out. So, if I am looking at the daily chart, I will also look at the weekly chart for S/R. Traders often forget that technical analysis is important in the very long term. Here’s an example of a long-term support level on the USD/CAD that was first formed in 2017 and re-tested in 2021.
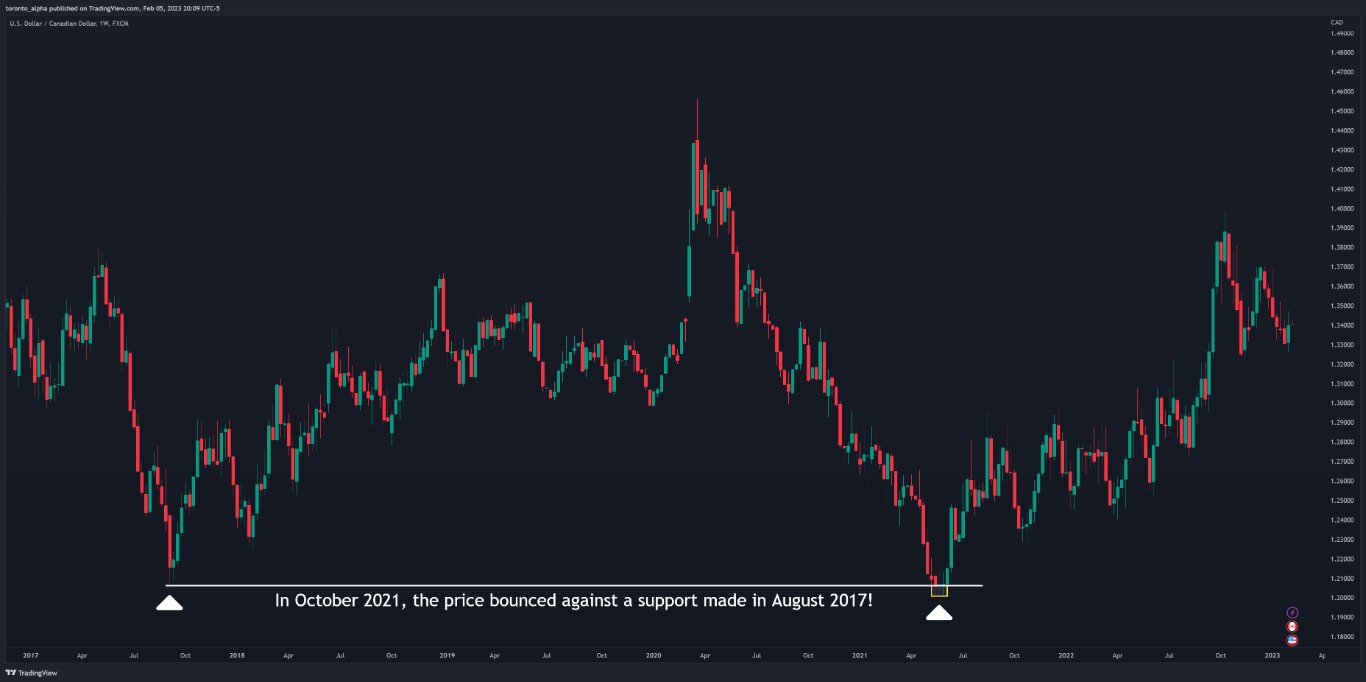
Marking this long-term support on the USD/CAD chart prevented me from going short in a downtrend near support, and it also helped me catch the new uptrend in 2021.
Step 3: Next, I look for a trend or chart pattern to form and continually mark the rising support or resistance levels. At this stage, I want to develop a bias for either long or short trades. For example, if I am monitoring an uptrend, I will have a long bias. If I am monitoring a potential head & shoulders reversal at the end of an uptrend, I will have a short bias.
Step 4: Once the price breaks a support or resistance level that I marked in the direction of my bias, I want to see the price retest it from the other side, i.e., make an S/R role reversal.
Step 5: As part of the re-test of the S/R role reversal, ideally, I want to see the price make a candlestick reversal formation so I can time my entry. The two candlestick reversal patterns I focus on the most are pin bars and engulfing bars.
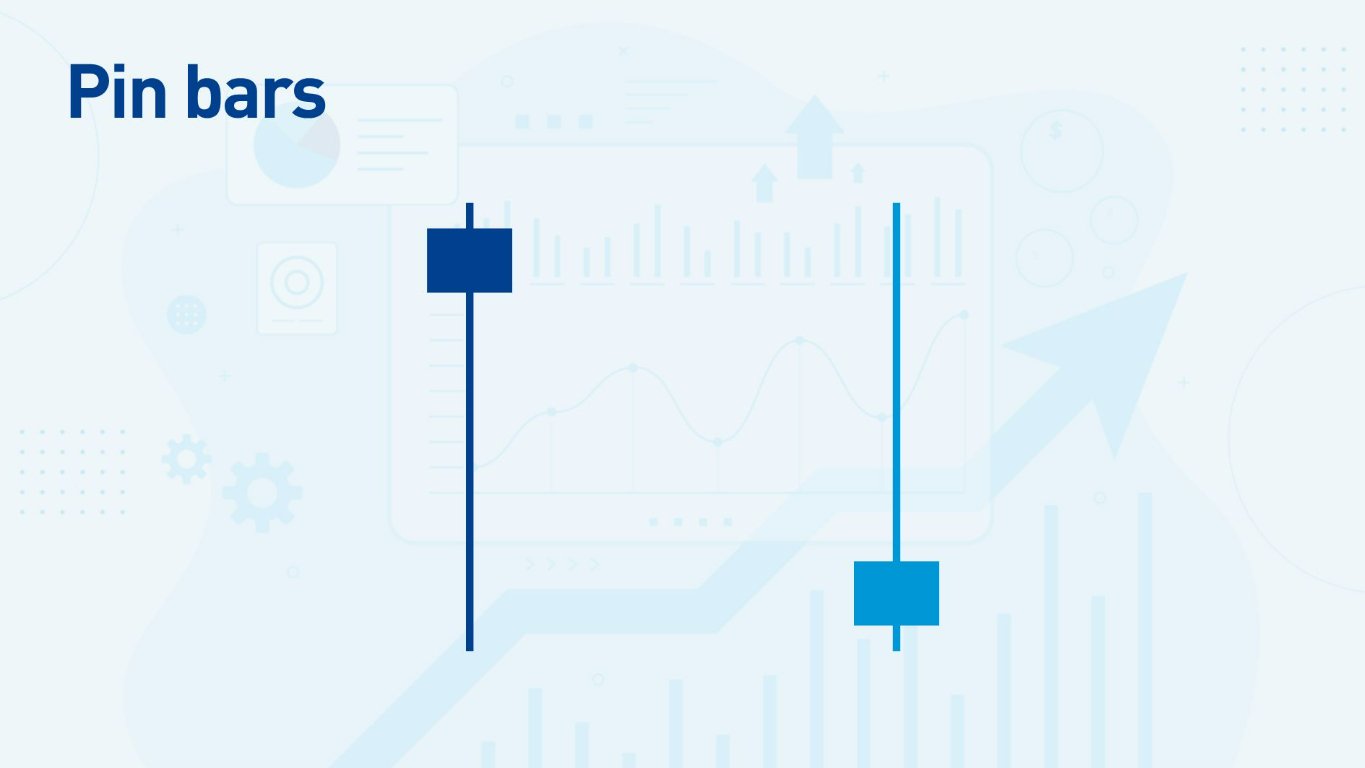
A pin bar is where the candlestick’s body is contained within the top or bottom third of the entire length of the candle. I prefer pin bars with long tails.
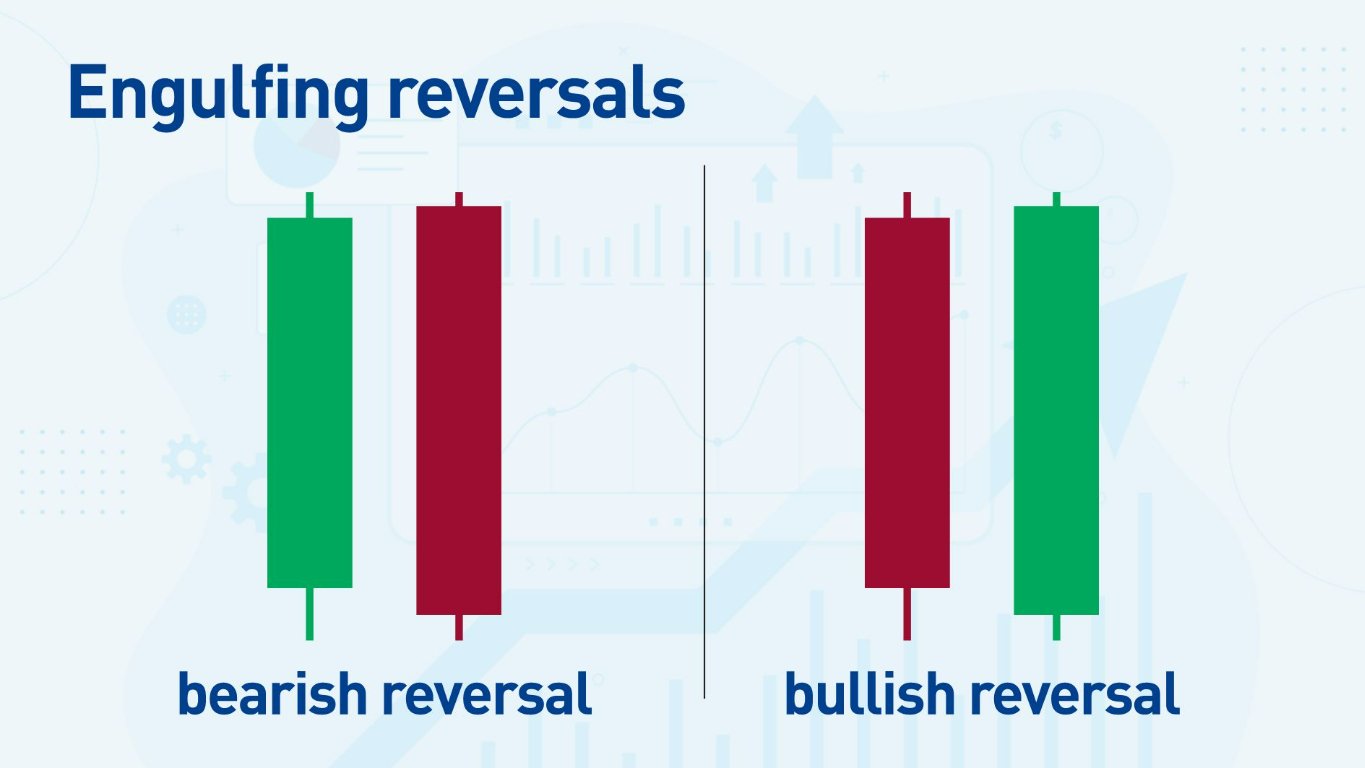
A bullish engulfing candlestick pattern is a long green candle followed by a long red candle, each with bodies more than two-thirds of the candle length.
Step 6: I keep a stop loss at a level where if the price reaches it, the trade is obviously going badly. The stop-loss is often above or below a previous high or low. My profit target is always at least 1.5 times my risk, and I make sure I can have a target that does not run into any long-term S/R levels that could stall my trade. This means I won’t take a trade if the nearest support or resistance level is any closer than that.
Using this as a support and resistance trading strategy, let’s look at three trades on a daily EUR/USD chart.
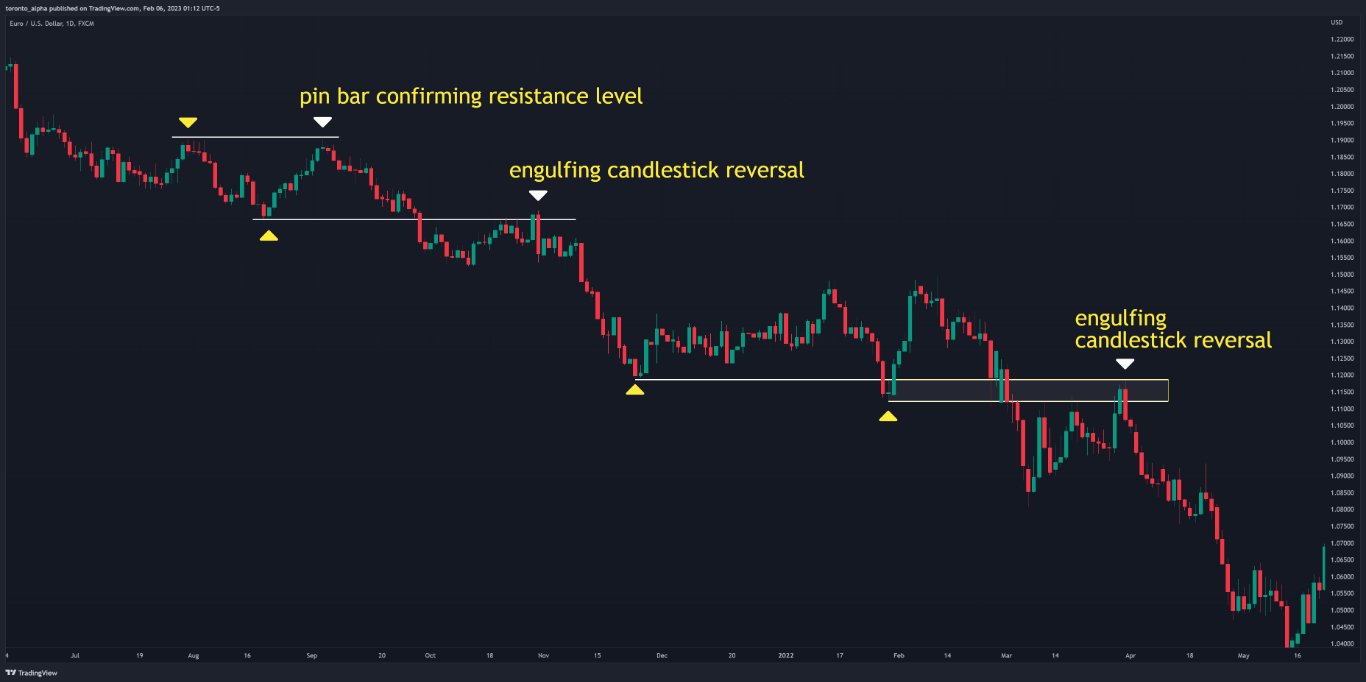
Trade #1: The price had started trending down and printed a resistance level. The price then bounced against this resistance with a pin bar. It was a near-exact bounce, giving me a precise entry into the downtrend.
Trade #2: Later, in the same downtrend, a support level turned into resistance when the price made an engulfing reversal. I was able to enter immediately after this bearish candlestick setup.
Trade #3: Like the second trade, the price retests the support level as a resistance level with a bearish engulfing setup. Note how I’ve marked a support zone on this trade, because there are two support levels close to each other.
Let’s look at another type of trade employing a support and resistance trading strategy: a head and shoulders reversal on the AUD/USD daily chart.
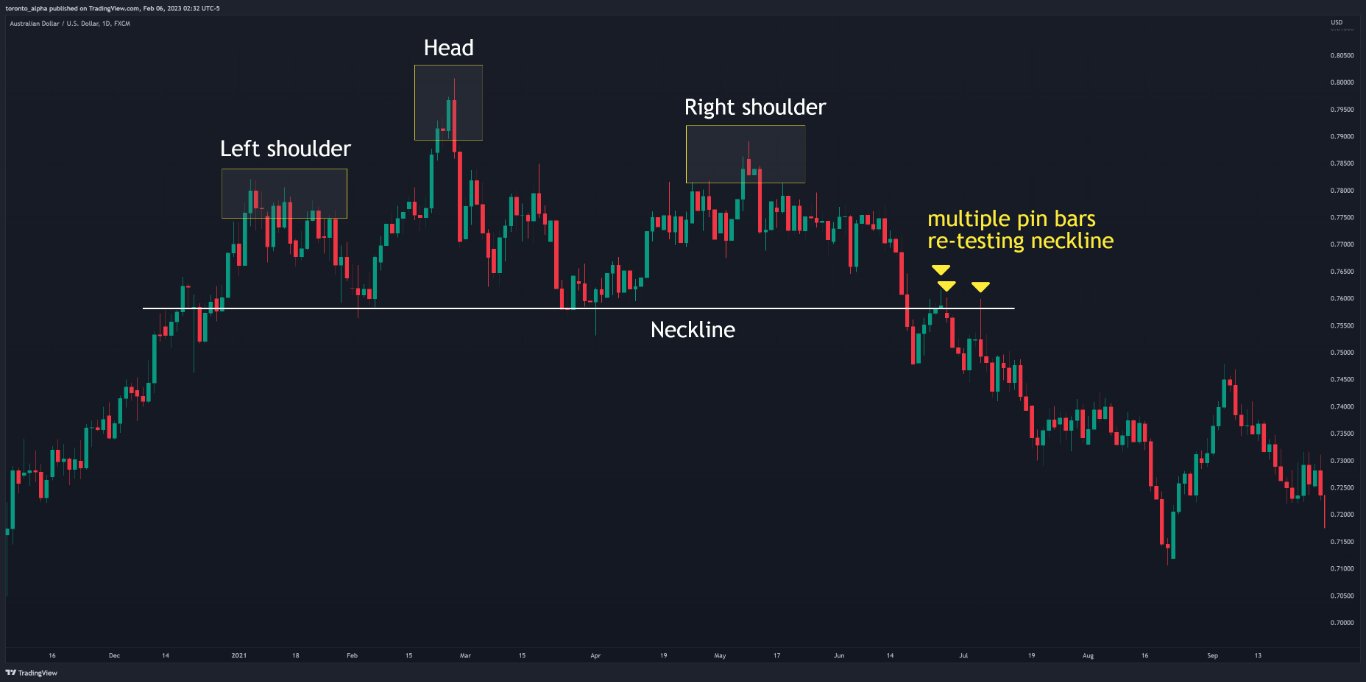
The head and shoulders pattern was a clear indication of a reversal after an uptrend, and the neckline retest was an equally clear S/R role reversal with multiple pin bars. This trade demonstrates that combining the basics of S/R and candlesticks can get you great trades.
Bottom Line
Support and resistance analysis is the clearest way to read the market. The first thing I do when I look at a new chart is to mark the major S/R levels on my current timeframe that I am using to find trade entries, and one timeframe higher. This can give me an excellent roadmap of the market.
From there, I can find ways to enter trends and chart patterns. I can time my entries with a few simple tools, like basic candlestick setups. These methods take some practise, but they are not extremely difficult, and they can be very effective.
FAQs
Does support and resistance really work?
Yes. It takes practice, and nothing in trading is guaranteed, but support and resistance is a genuine concept that can produce real results over time.
What is the best indicator for support and resistance?
MACD and RSI are excellent indicators to help confirm support and resistance.
How do you find strong support and resistance?
You can best find strong support and resistance by looking for areas where the price has historically bounced convincingly and moved a large distance.
How do you confirm a support or resistance break?
A support or resistance break is best confirmed by a retest from the other side, i.e., a role reversal, and it should be broken convincingly with a long candlestick.
Which chart shows support and resistance?
You can see support and resistance levels on candlestick charts, bar charts, and line charts. Use line charts only for higher timeframes—daily and above.
How many types of support and resistance are there?
There are minor and major support and resistance levels, and levels which are in the direction of the trend or countertrend.
