
Diamond patterns, rare but frequently profitable, are a combination of a broadening pattern and a triangle. The pattern doesn’t have to be completely symmetrical.
They can occur after prices rise or after a descent. Regardless of when they form, the breakout can be in either direction.
They tend to be fast moving when they do break so you want to be ready to trade when you see one. Sometimes there’s a pullback or throwback after the breakout. A pullback is when price retraces from a break downward; a throwback is when price retraces after a break upward. Some traders believe pullbacks and throwbacks weaken the profit potential of the pattern but it offers another chance to enter the trade if it occurs. Stops are placed inside the pattern. This limits the potential loss if the pattern doesn’t work out.
This week I found two diamond formations. One was on the USDCAD 15-minute chart. This one occurred after a slight rise from support. The breakout candle upwards was strongly bullish. Had the breakout been downward, the price potential would have been limited by the support line—prices might have had a problem getting below that line.
After the initial breakout there was a small retracement not quite back to the breakout point of 1.0507. Then it began climbing into the next day, reaching a high of 1.0689 for a total gain of 182 pips.
You can calculate the profit target by taking the difference between the high and low of the pattern. In this case it was 66 pips. You then add that to the breakout price if it’s an upward breakout or subtract if it’s a downward breakout. Since this broke upward, the target was 1.0573. Once it reaches the target you can close part of the trade to take some partial profits and move your stop to breakeven or slightly above. You can then trail your stop if price continues moving upward.
Here’s what the trade looked like on the chart. 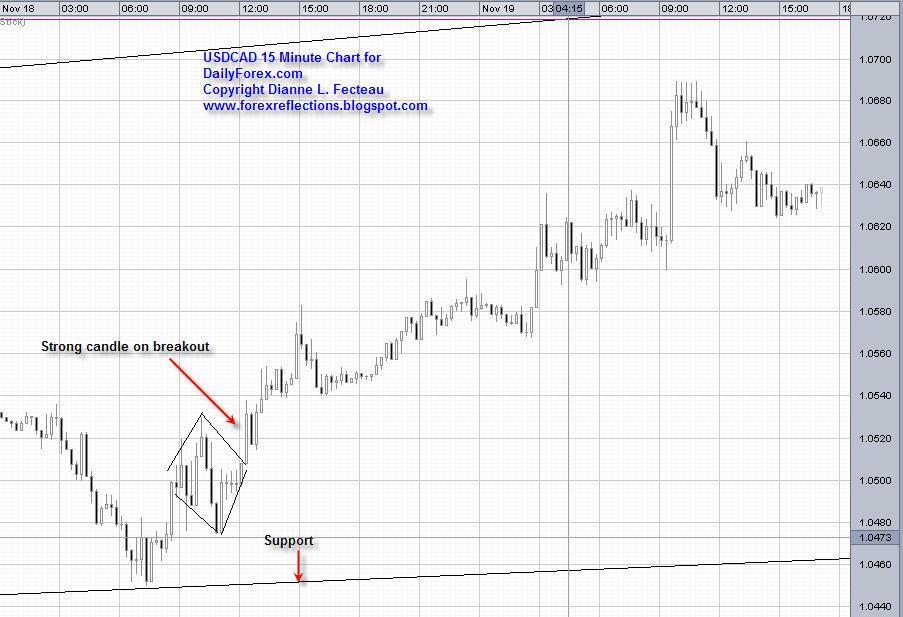
The second pattern was in the EURUSD. Here the pair was in an uptrend but the price broke downward. The height of the diamond was 72 pips. The breakout price was 1.4954 so the price target was 1.4882. Again, you would have wanted to take partial profits there and move your stop to breakeven or better. In this case, the pair ran into a strong support zone at 1.4843 which repelled the downward movement. Now that the pair is climbing again, minor resistance is often found at the breakout point. 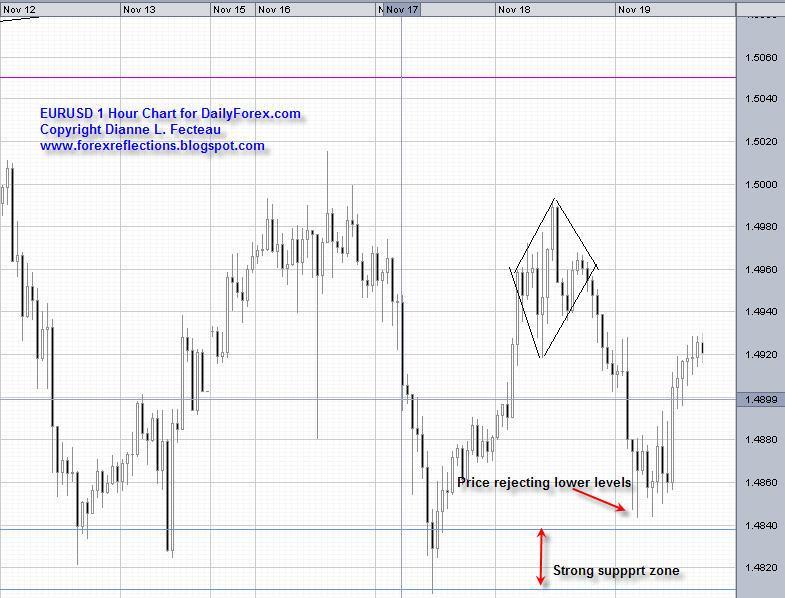
While these are profitable patterns, always exercise caution when trading. It’s safest to wait until a candle closes outside the diamond formation before placing a trade. Also, look for support and resistance zones before you place your trade. If they’re nearby, they can reduce the potential risk to reward ratio.