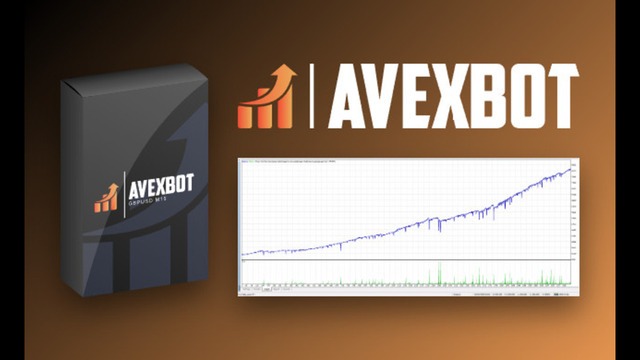
End of the month and quarter: confidence reigns

It is hard to believe that 2009 is half over today!  For those of us who have been “the glass is half empty” because of the recession/depression/economy gone bad, maybe the second half will be better.  But for intraday forex traders, this market has actually been quite nice for making consistent pips, especially this second quarter.  Typically I pull in about +200 pips per week, but my average has actually increased to almost +250 per week in the past few weeks.  The thing with forex trading, as soon as you start to celebrate your wins, you may get knocked down a few notches with some losses, but so far so good.  In June my average weekly winning percentage actually decreased from 82% to 79% winning trades, but my losses have been lower, therefore my overall pip intakes has increased.  Pretty cool.  I guess I am quite a geek for being so interested in the statistics of forex trading, but truly it is just as important to track all of that each and every week, as it is to actually do the trading.  The reason:  it will improve your confidence immensely in order to properly act at each trade opportunity rather than second guess yourself.   I “feel” better about entering a trade when I have my trade entry confirmation when I know that they past 4 weeks I have seen 80% of these exact trades do win.  It makes me sweat less.  Along with the confidence of consistent trading, tracking the stats week in and week out will help you determine best days of the week to trade, best times of the month and year to trade.  These markets are so cyclical.  I have mentioned before in another post that during different times of the year the New York session is good and easy trading, while other times the Asia and/or London are much better and smoother.   One way to track your weekly/monthly/yearly trading performance is to track your profit factor.  Profit factor is your Gross Profit divided by your Gross Losses.  For example:  if you make 10 trades in June and 7 are profitable for $15,500, and 3 are losers for $4,100, your profit factor is $15,500/$4,100 or 3.78.  The goal is to keep your profit factor consistently about the same, and definitely above a 1.0 profit factor, which is break even.  It will make you feel pretty good when you master your trading strategy each month with a consistent profit factor, and the cash you made will make you feel pretty good too.  July here we come!

GBPUSD is stuck

If there is any doubt about how stuck the market can get during the summer, check out the GBPUSD pair on the daily chart.  Since June 10 this currency pair has been in a tight range from 1.6200 to 1.6600, that is nearly 3 weeks.  Even in summer quiet trading these currency pairs cannot stay in such a tight range for very long.  I expect there will be a breakout soon, possibly this week since we have the U.S. Non-Farm Payrolls data on Friday, the mother of economic news releases.   Also of interest is the weekly pivot point at 1.6445.  This point has already posed a decent support in early Asia trading on Monday, it is possible that a new base will start building in this area in order to create momentum for a break to the upside.  So is the USD ready to re-engage its recent weakening trend?  The last few weeks the USD has been stuck, trapped against a very important support line on the dollar index chart at 79.00.  Any significant break below this will help to confirm a breakout to the upside for the GBPUSD.  But wouldn’t it be more feasible that the USD will actually strengthen, since it is so weak against the majors currently?  Yes, I understand that the U.S. government is printing money to dig the country out of its economic ditch, which in theory should weaken the currency significantly.  But technically speaking, as a trader I have to think that the dollar is still king, even in this horrid little depression.  So I find it more feasible for the dollar to strengthen over the next several months and continue in this range that it has built on the dollar index chart, as long as it remains above the all important 79.00.  Range trading is most probable until we actually see the break.  Therefore, if this theory is correct, the GBPUSD is more likely to breakout to the downside, possible retesting the 1.5900 level, where the daily 50ema is currently.  Of course, anything can happen.  I hope we get some nice market moves this week..

Summer trading volume means $$$

It is summertime.  Stock traders often say “sell in May and go away”, betting on the light trading volume that summer brings to slowly grind stock indices down over the slow summer months.  But not so for day trading currency traders, who can be raking in the big pips and big bucks if they play their cards right.  Here’s some tips for light summer volume forex trading to keep the summer blahs away:

1.  Range trading is king.  With light volume often comes less ability for market makers to move currency pairs much outside their current ranges.  But this is not 100%, if there are less players in the market, then it will also take less players to move the market.  Moves can be sharp, so you have to be quick on the draw.  Typically currency pairs will move in beautiful wide swings, perfect for day traders or swing traders.

2.  Use your fibonacci tool.   For some reason the fib tool extensions seem to work even more precisely during the summer, maybe because the big money institutional traders are out of the market (they are all at the Hamptons), so us little traders can push a pair exactly to where we want it to go.  I enjoy fibbing the most recent 2 or 3 hour range ending at 7 am EST and then taking the trade to the 261% fib extension.

3.  It is summer, take your profit then go to the beach.  For intraday trading, my trade target is usually hit within 2-3 hours.  If I can be in the money by the time London closes at 11am EST, then I take the profit and shut it down.  Why waist more time waiting for the next trade set up when you can outside enjoying summer?  Take the money and run.  Tomorrow is another day.

Summertime is perfect for intraday and swing traders to rake in the big pips, due to the typical large swings that currency pairs are making.  Just be sure to be on the right side of the market’s current move and you can easily make +100 pips per day.  Rake it in now during the easy months before the big money traders come back into this market and mess everything up!  Good trading.

GBPJPY is following my plan

GBPJPY has been playing right into my trading plan this week.  I started piling on shorts after I saw the evening star confirm on the daily chart on Monday for 3 trades of +100 pips each.  I was targeting 155.00 as stated in my previous post, and sure enough price hit 155.00 almost to the pip today in London trading.  When I woke this morning to check my charts at 7am New York time, I saw a golden opportunity staring at me in the face!  Since the target had been hit and price was consolidating near 155.50, the smaller time frames were oversold at that point, just prior to the 8:30am news release.  I figured there could be more room for a movement to the upside at that point, especially since the news was jobless claims which has been moving the markets positively the past several weeks.  Also pointing up:  there was positive divergence on the CCI on the 1 hour chart.  So, about 15minutes after the news released I entered a long trade at 156.10.  I managed to hang on for +100 pips, it was a quick trade, about an hour and a half.  So now it looks like the GBPJPY is following along my big picture trade plan:  it appears to indeed be heading back up to possibly form the right shoulder of this head and shoulders pattern on the daily chart.  If you fib from the high at 162.50 to the recent low at 155.00, the 61.8% retracement is 159.60, pretty darn close to the 160.00 area I was originally thinking.  I will observe the price action at that level (if it gets there) and look to enter a short to ride this back down to the neckline again at 155.00.  Of course, price may not have the strength to reach 160 area, or it could blow right through it.  That is why I prefer to set an alert for my price targets to actually see how price behaves before making any decisions.  Wish me luck, and good luck to you.

GBPJPY evening star candle pattern

The GBPJPY daily chart confirmed an evening star reversal candlestick pattern at today’s close, and into this evening’s Asia trading price has fallen quite hard on this pair already.  For weeks now I have been happy to be buying up this pair at every chance but now with this confirmed reversal pattern I suspect price is ready to retest the daily 50ema, now near 151.00.  The negative divergence outlined on the CCI indicator also indicates that a large retracement is looming.   I like this pattern better than the recent fake out similar pattern eight days ago, which did confirm but then promptly again re-entered its upward channel the very next day, it faked me out pretty good and I took about a -50 loss on it.  But the reason I like this most recent evening star pattern is that it is coupled with the negative divergence on the CCI and the CCI is already pointing down and back through the 100 line.  I am thinking that the GBPJPY price action may end up making a large down pointing head and shoulders pattern, with a neckline building at the 155.00 level.  If that does happen then I will be looking for price to continue to fall to the 155.00 area this week, then see if price rebounds to indeed build a right shoulder around 160.00.   If price does get there, then I will enter a short trade there back to 155.00.  But I am getting ahead of myself here!  First, I will look for more shorting opportunities down to 155.00.  I expect 155 to hold support but there is also a chance that price will knife through there and head on to the daily 50ema near 151.00.  Good luck and good trading.

gj061509a

USD index sinks toward critical support

The US dollar index sank to 79.29 so far today, toward a critical support sitting at 78.50 that held back in December 08.  The fundamentals are clearly in control of this currency for now, but contra traders are looking for an opportunity to jump into long dollar trades once the greenback finds some support around this level.  The dollar should find some resilience, it cannot fall like a rock, right?  EURUSD is reaching for 1.4150 - 1.4200 which was reached when the USD index hit this support level.  I am watching the Dow as it may start a new dip today or next week, bringing some money back into testing the old “safe haven” drill of buying up dollars.  In the longer term I am still bearish the USD, but a good retracement is likely at this point in my opinion.  The weekly EURUSD 100ema is sitting daintily at 1.4225, that could be the target for longs to get out, and for shorts to get in.  Cheerio.

Riding the 5ema

I like to use the 5ema on the daily chart to determine my bias at the beginning of my trading day.  Since lately I have been using the GBPJPY for my intraday trading, I have included my daily chart with the 5ema in red.  It is a fair assumption that if the daily candle closes above the 5ema, it is likely to continue moving up for the next day.  Conversely, a close of the daily candle below the 5ema would signal the likelihood that the next day’s price action would also move down.  This very simple method of determining direction is not 100%, but in my experience it does work about 80% of the time.  Last week was a spectacular week on this pair for intraday trading.  The white arrow shows Monday’s price action, crossing from bottom to top over the 5ema.  My bias on this pair was DOWN on Monday, since Friday’s close was below the 5ema.  So on Monday morning I looked for a good entry for a short and entered, but quickly price ran against me and I closed my trade for -52 pips.  But with Monday’s candle closing above the 5ema, my bias then turned to upside.  In fact all of my trades on this pair remained with a buy bias, and I made about +100 pips on each trade, 4 days in a row.  Not too shabby.   The key to this method of finding trade direction bias is to just look at the daily close in relation to the 5ema.  Do not let the wicking price action during the day trick you into a contrary trade.  This happened several times last week where price fell back down, reaching below the daily 5ema but only to actually end the day back above the 5ema level, signaling a continuation in the upside bias.  Taking profit on this type of trading is up to you.  For me, a cool 50-100 pips per trade is perfectly good.  I like to look for entries at the hourly 20sma or the bottom bollinger band if I am upward biased.  This way my stop loss can be placed just 40 pips below that, a good risk/reward trade.  Good trading!

Daily GBPJPY chart

USDJPY perfect neckline test for further downside

The USDJPY made a perfect bounce and test of the neckline at 96.50, an excellent entry for shorts looking to cash in on the large head and shoulders pattern on the daily chart.   Price is currently testing an important support at 94.50, historically an important level.  Beyond that, 93.60 and 92.40 are the next supports to target before the final target at 89.50.  Meanwhile price also still remains in the newly formed down channel, and if price continues downward inside this channel it will take all summer to reach the final target.  Of course, with the US dollar in such bearish sentiment currently,  it is likely that the USDJPY will break down through the lower channel line more quickly.  All eyes are definitely watching the action on the dollar, many economists and the like have been waiting for dollar weakness to kick in in a big way ever since the US government’s stimulus actions, bank bailout, and essentially dollar printing should impact dollar based currencies profoundly.  Today’s release of the FOMC minutes from last month’s meeting again prompted more dollar selling when the news showed the Fed is not against additional buying up of treasuries, a sure-fire way to kill the currency.  Best bet for us currency traders:  sell the dollar, sell the dollar big.  Good trading.

Daily USDJPY

USDJPY: brilliant week

After pointing out the two head & shoulders patterns last Friday, the USDJPY tested the neckline of the smaller inverse pattern after NFP last Friday and never hesitated, falling all week this week to break the larger head & shoulders pattern neckline near 96.50.  Attached is the daily chart of this pair, with the obvious pattern in view, neckline is in blue.  The nearly 400 pip move this week is surely a precursor of what is to come in the coming weeks.  Since the neckline of this larger head & shoulders pattern broke, I am expecting further downside, potentially all the way to 89.60 area.  The new dotted white lines outline a new down trend channel that has also emerged.  Any price pop ups should be good for selling into, as long as this new down channel upper line holds.  In fact, with large patterns like this one, and such a large move this week, I would not be surprised if this pair continues its fall without much retracement at all.  Target for the pattern points to 89.60 area.  Only price above the newly formed down channel would make me reconsider shorts.

USDJPY daily chart

The dollar/yen technical dilemma

There are several forces that are pulling and pushing on the USDJPY as is evidenced by the daily chart attached.  A large head and shoulders pattern, in pink, has been slowly developing since the breakout of the up channel, in white, some weeks ago.  But in the past 10 days a smaller inverse head and shoulders pattern is now evident, in blue.  It is important to note that the neckline of the inverse H&S, in orange, is also a trendline slanting down from a previous resistance, obviously still remaining very important and respected.  So how does one trade all of this?  Thursday and Friday there is important economic data expected:  the EUR and GBP interest rate decisions on Thursday and then the NFP unemployment data on Friday.  Everyone is waiting for this news before making any big moves.  This is evident in this sort of price action:  making chart patterns within chart patterns, creating a technical dilemma.  So I for one will wait for price to tell me the direction and then pounce on it, because this sort of ranging and pattern making always preceeds a big move.  In case this pair heads higher after the news, 99.50 is the level to watch.  Price breaking 99.50 and then retesting it for a buy entry, confirms the inverse head and shoulder and also fails the larger pink head and shoulders at the same time, since a move above the right shoulder is a pattern failure.   Target for longs is then 103.50 area.  If, however, price decides to head downward after the news, 95.60 is the neckline to break for continued fall.  A break, retest, and subsequent fall would then target 89.70 region.   The important thing about trading these types of chart patterns is to wait until the break happens then look for a retest to confirm the move.  Fakeouts are likely.  Good trading, and be careful, use your stops.

uj050609

Next Page »